A 3D version of ggplot2::geom_smooth().
Creates surfaces by fitting smoothing models to scattered (x,y,z) data points.
The fitted statistical model is evaluated on a regular grid and rendered as a
3D surface with optional standard error surfaces.
Usage
geom_smooth_3d(
  mapping = NULL,
  data = NULL,
  stat = StatSmooth3D,
  position = "identity",
  ...,
  method = "loess",
  formula = NULL,
  method.args = list(),
  xlim = NULL,
  ylim = NULL,
  n = NULL,
  grid = NULL,
  direction = NULL,
  trim = NULL,
  domain = c("bbox", "chull"),
  se = FALSE,
  level = 0.95,
  se_fill = NULL,
  se_colour = NULL,
  se_color = NULL,
  se_alpha = 0.5,
  se_linewidth = NULL,
  points = FALSE,
  point_colour = "black",
  point_color = NULL,
  point_fill = NA,
  point_size = 1.5,
  point_shape = 19,
  point_alpha = 1,
  point_stroke = 0.5,
  residuals = FALSE,
  residual_colour = "black",
  residual_color = NULL,
  residual_linewidth = 0.5,
  residual_linetype = 1,
  residual_alpha = 1,
  light = NULL,
  cull_backfaces = FALSE,
  sort_method = NULL,
  force_convex = TRUE,
  scale_depth = TRUE,
  na.rm = FALSE,
  show.legend = NA,
  inherit.aes = TRUE
)

stat_smooth_3d(
  mapping = NULL,
  data = NULL,
  geom = GeomPolygon3D,
  position = "identity",
  ...,
  method = "loess",
  formula = NULL,
  method.args = list(),
  xlim = NULL,
  ylim = NULL,
  n = NULL,
  grid = NULL,
  direction = NULL,
  trim = NULL,
  domain = c("bbox", "chull"),
  se = FALSE,
  level = 0.95,
  se_fill = NULL,
  se_colour = NULL,
  se_color = NULL,
  se_alpha = 0.5,
  se_linewidth = NULL,
  points = FALSE,
  point_colour = "black",
  point_color = NULL,
  point_fill = NA,
  point_size = 1.5,
  point_shape = 19,
  point_alpha = 1,
  point_stroke = 0.5,
  residuals = FALSE,
  residual_colour = "black",
  residual_color = NULL,
  residual_linewidth = 0.5,
  residual_linetype = 1,
  residual_alpha = 1,
  light = NULL,
  cull_backfaces = FALSE,
  sort_method = NULL,
  force_convex = TRUE,
  scale_depth = TRUE,
  na.rm = FALSE,
  show.legend = NA,
  inherit.aes = TRUE
)
Arguments
- mapping
Set of aesthetic mappings created by
aes(). This stat requiresx,y, andzaesthetics from the input data. By default, fill is mapped toafter_stat(fitted).- data
The data to be displayed in this layer. Must contain x, y, z columns.
- stat
The statistical transformation to use on the data. Defaults to
StatSmooth3D.- position
Position adjustment, defaults to "identity". To collapse the result onto one 2D surface, use
position_on_face().- ...
Other arguments passed on to the layer function (typically GeomPolygon3D), such as aesthetics like
colour,fill,linewidth,annotate = annotate_3d(...), etc.- method
Smoothing method to use. Currently supported:
"loess"(default): Local polynomial regression"lm": Linear model"glm": Generalized linear model"gam": Generalized additive model (requiresmgcvpackage)
- formula
Model formula. If
NULL(default), uses method-appropriate defaults:z ~ x + yfor lm and glm,z ~ s(x) + s(y)for gam, auto for loess.- method.args
List of additional arguments passed to the fitting function. For loess, this might include
spanordegree. For lm, this might includeweights. For glm, this might includefamily(defaults togaussian()). For gam, this might include smoothing parameters or basis specifications.- xlim, ylim
Numeric vectors of length 2 giving the range for prediction grid. If
NULL(default), uses the exact data range with no extrapolation.- grid, n, direction, trim
Parameters determining the geometry, resolution, and orientation of the surface grid. See grid_generation for details.
- domain
Character indicating the x-y domain over which to visualize the surface. The default,
"bbox", shows predictions over the full rectangular bounding box of the predictors.The alternative,"chull", shows predictions only within the convex hull of the input data, which prevents extrapolation into unoccupied corners of predictor space.- se
Logical indicating whether to display confidence interval bands around the smooth; if
TRUE, these are rendered as additional surfaces; they inherit aesthetics from the primary smooth layer unless otherwise specified. Defaults toFALSE.- level
Level of confidence interval to use (0.95 by default).
- se_fill
Fill colour for confidence interval bands. If
NULL, inherits from the main surfacefillaesthetic.- se_colour, se_color
Color for confidence interval band borders. If
NULL, inherits from the main surfacecoloraesthetic.- se_alpha
Alpha transparency for confidence interval bands. Defaults to 0.5.
- se_linewidth
Line width for confidence interval band borders. If
NULL, inherits from the main surfacelinewidthaesthetic.- points
Logical indicating whether to overlay the original data points on the fitted surface. Points are depth-sorted together with the surface polygons for proper 3D rendering. Point styling is controlled via the
point_*parameters; mapped aesthetics from the layer are not inherited by annotation points. Default isFALSE.- point_colour, point_color
Color for data points. Defaults to
"black".- point_fill
Fill color for data points (only relevant for shapes 21-25). Defaults to
NA(transparent).- point_size
Size of data points.
- point_shape
Shape of data points.
- point_alpha
Alpha transparency for data points.
- point_stroke
Stroke width for data points.
- residuals
Logical indicating whether to draw residual lines connecting data points to the fitted surface. Default is
FALSE. Residual styling is controlled via theresidual_*parameters. Note: residual lines may render incorrectly when combined withse = TRUE, as the lines intersect the confidence interval surfaces and cannot be split at intersection points.- residual_colour, residual_color
Color for residual lines.
- residual_linewidth
Line width for residual lines.
- residual_linetype
Line type for residual lines.
- residual_alpha
Alpha transparency for residual lines.
- light
A lighting specification object created by
light(),"none"to disable lighting, orNULLto inherit plot-level lighting specs from the coord. Specify plot-level lighting incoord_3d()and layer-specific lighting ingeom_*3d()functions.- cull_backfaces
Logical indicating whether to remove back-facing polygons from rendering. This is primarily for performance optimization but may be useful for aesthetic reasons in some situations. Backfaces are determined using screen-space winding order after 3D transformation. Defaults vary by geometry type: FALSE for open surface-type geometries, TRUE for solid objects (hulls, voxels, etc. where backfaces are generally hidden unless frontfaces are transparent or explicitly disabled).
- sort_method
Depth sorting algorithm. See sorting_methods for details.
- force_convex
Logical indicating whether to remove polygon vertices that are not part of the convex hull. Default value varies by geom. Specifying TRUE can help reduce artifacts in surfaces that have polygon tiles that wrap over a visible horizon. For prism-type geoms like columns and voxels, FALSE is safe because polygons fill always be convex.
- scale_depth
Logical indicating whether polygon linewidths should be scaled to make closer lines wider and farther lines narrower. Default is TRUE. Scaling is based on the mean depth of a polygon.
- na.rm
If
FALSE, missing values are removed.- show.legend
Logical indicating whether this layer should be included in legends.
- inherit.aes
If
FALSE, overrides the default aesthetics.- geom
The geometric object used to display the data. Defaults to
GeomPolygon3D.
Aesthetics
stat_smooth_3d() requires the following aesthetics from input data:
x: X coordinate
y: Y coordinate
z: Z coordinate (response variable to be smoothed)
Computed variables specific to StatSmooth3D
level: Type of surface ("fitted", "upper CI", or "lower CI" for confidence bands)fitted: Smoothed predictions (same aszwhenlevel == "fitted")se: Standard errors of the fitted values (available whense = TRUE)
Computed variables
The following computed variables are available via after_stat():
x,y,z: Grid coordinates and function valuesnormal_x,normal_y,normal_z: Surface normal componentsslope: Gradient magnitude from surface calculationsaspect: Direction of steepest slope from surface calculationsdzdx,dzdy: Partial derivatives from surface calculation
See also
stat_surface_3d() for surfaces from existing grid data,
stat_function_3d() for mathematical function surfaces.
Examples
# Generate scattered 3D data
set.seed(123)
d <- data.frame(
x = runif(100, -1, 3),
y = runif(100, -3, 3)
)
d$z <- abs(1 + d$x^2 - d$y^2 + rnorm(100, 0, 1))
# Base plot
p <- ggplot(d, aes(x, y, z)) +
coord_3d(light = NULL) +
scale_fill_viridis_c()
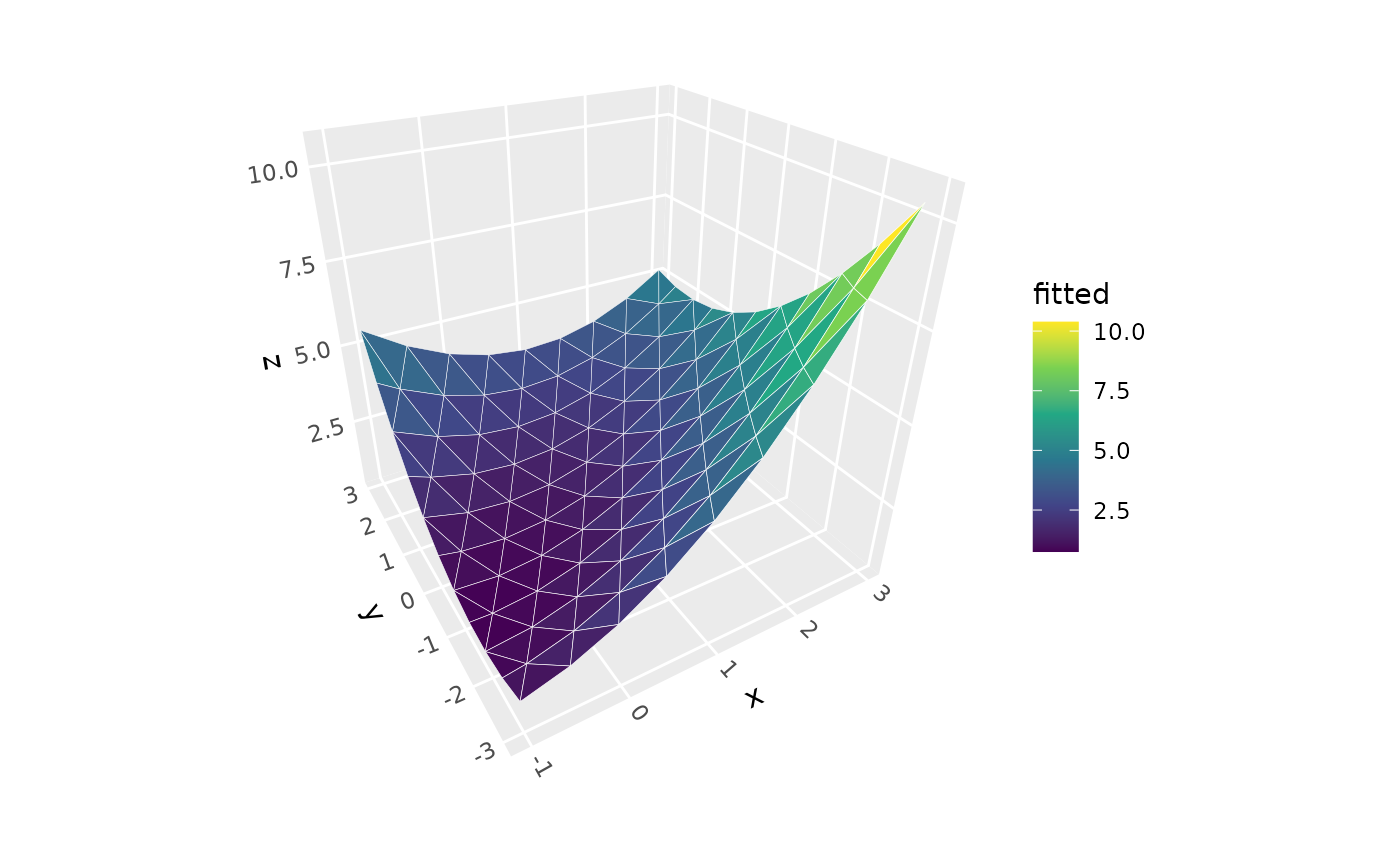
# Basic smooth surface with default loess model
p + geom_smooth_3d()
 # \donttest{
# Show data points
p + geom_smooth_3d(points = TRUE)
# \donttest{
# Show data points
p + geom_smooth_3d(points = TRUE)
 # Show data points with residual lines
p + geom_smooth_3d(points = TRUE, residuals = TRUE,
point_color = "red", alpha = .8)
# Show data points with residual lines
p + geom_smooth_3d(points = TRUE, residuals = TRUE,
point_color = "red", alpha = .8)
 # Linear model surface with 90% confidence intervals
p + geom_smooth_3d(aes(fill = after_stat(level)),
method = "lm", color = "black", se = TRUE,
level = 0.99, se_alpha = .7, n = 10) +
scale_fill_manual(values = c("red", "darkorchid4", "steelblue"))
#> Scale for fill is already present.
#> Adding another scale for fill, which will replace the existing scale.
# Linear model surface with 90% confidence intervals
p + geom_smooth_3d(aes(fill = after_stat(level)),
method = "lm", color = "black", se = TRUE,
level = 0.99, se_alpha = .7, n = 10) +
scale_fill_manual(values = c("red", "darkorchid4", "steelblue"))
#> Scale for fill is already present.
#> Adding another scale for fill, which will replace the existing scale.
 # Linear model surface with custom model formula
p + geom_smooth_3d(method = "lm", n = 10,
formula = z ~ poly(x, 2) + poly(y, 2) + x:y)
# Linear model surface with custom model formula
p + geom_smooth_3d(method = "lm", n = 10,
formula = z ~ poly(x, 2) + poly(y, 2) + x:y)
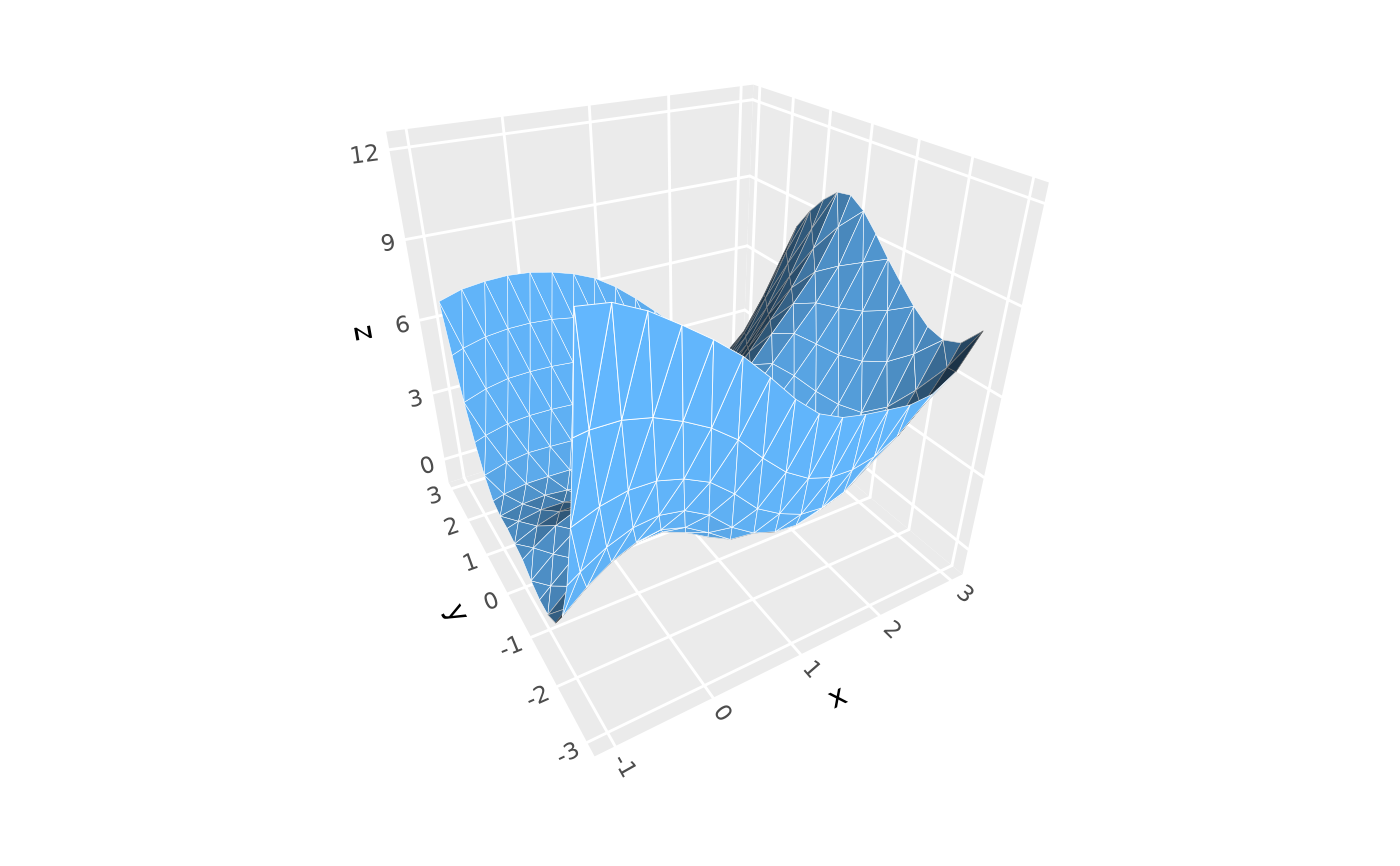
 # Loess with custom span parameter, and lighting effects
p + geom_smooth_3d(
method = "loess", method.args = list(span = 0.3),
fill = "steelblue", color = "white", n = 20,
light = light(direction = c(0, -1, 0), color = FALSE))
# Loess with custom span parameter, and lighting effects
p + geom_smooth_3d(
method = "loess", method.args = list(span = 0.3),
fill = "steelblue", color = "white", n = 20,
light = light(direction = c(0, -1, 0), color = FALSE))
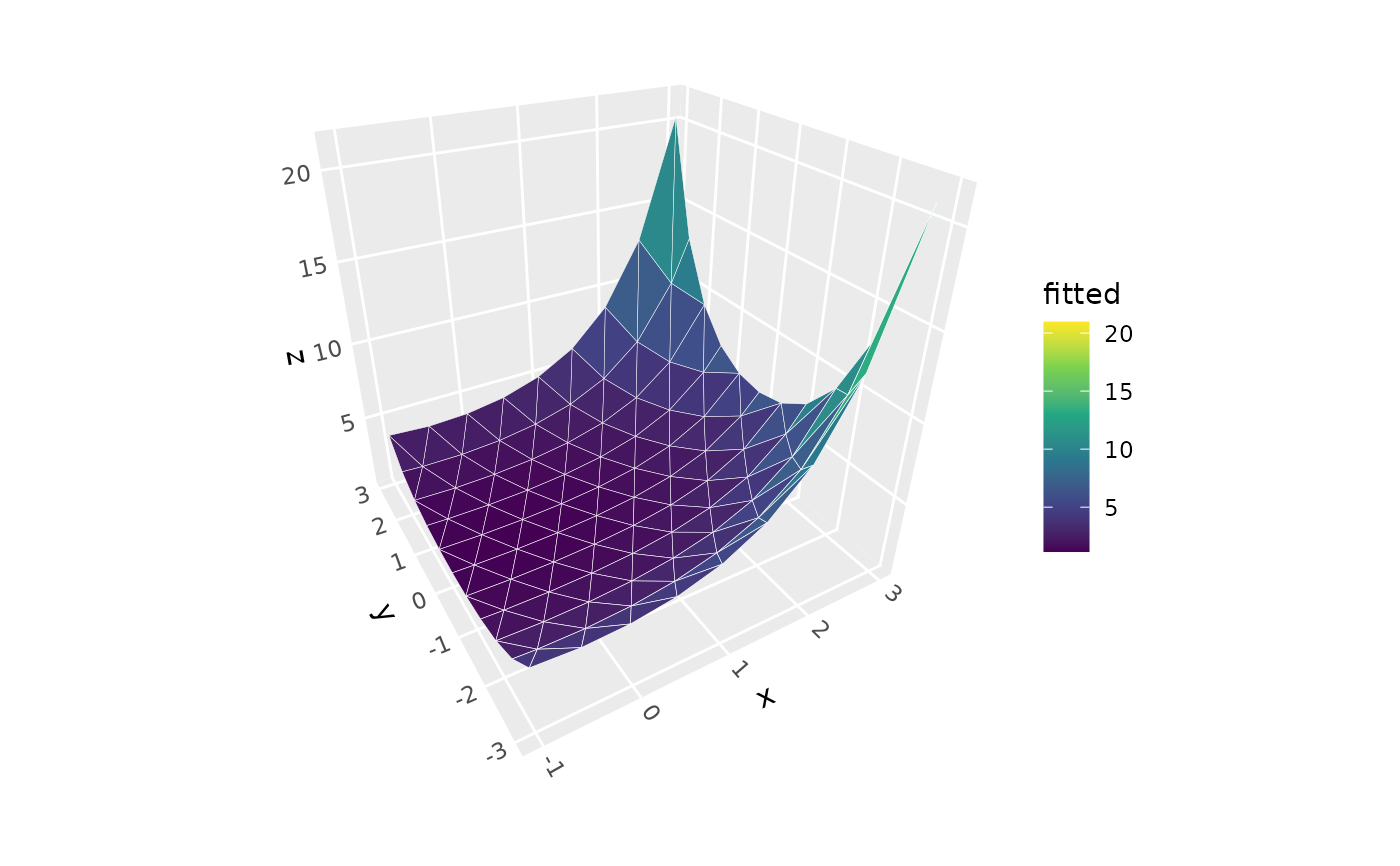
 # GLM with gamma family and log link
p + geom_smooth_3d(
method = "glm", n = 10,
method.args = list(family = Gamma(link = "log")),
formula = z ~ poly(x, 2) + poly(y, 2))
# GLM with gamma family and log link
p + geom_smooth_3d(
method = "glm", n = 10,
method.args = list(family = Gamma(link = "log")),
formula = z ~ poly(x, 2) + poly(y, 2))
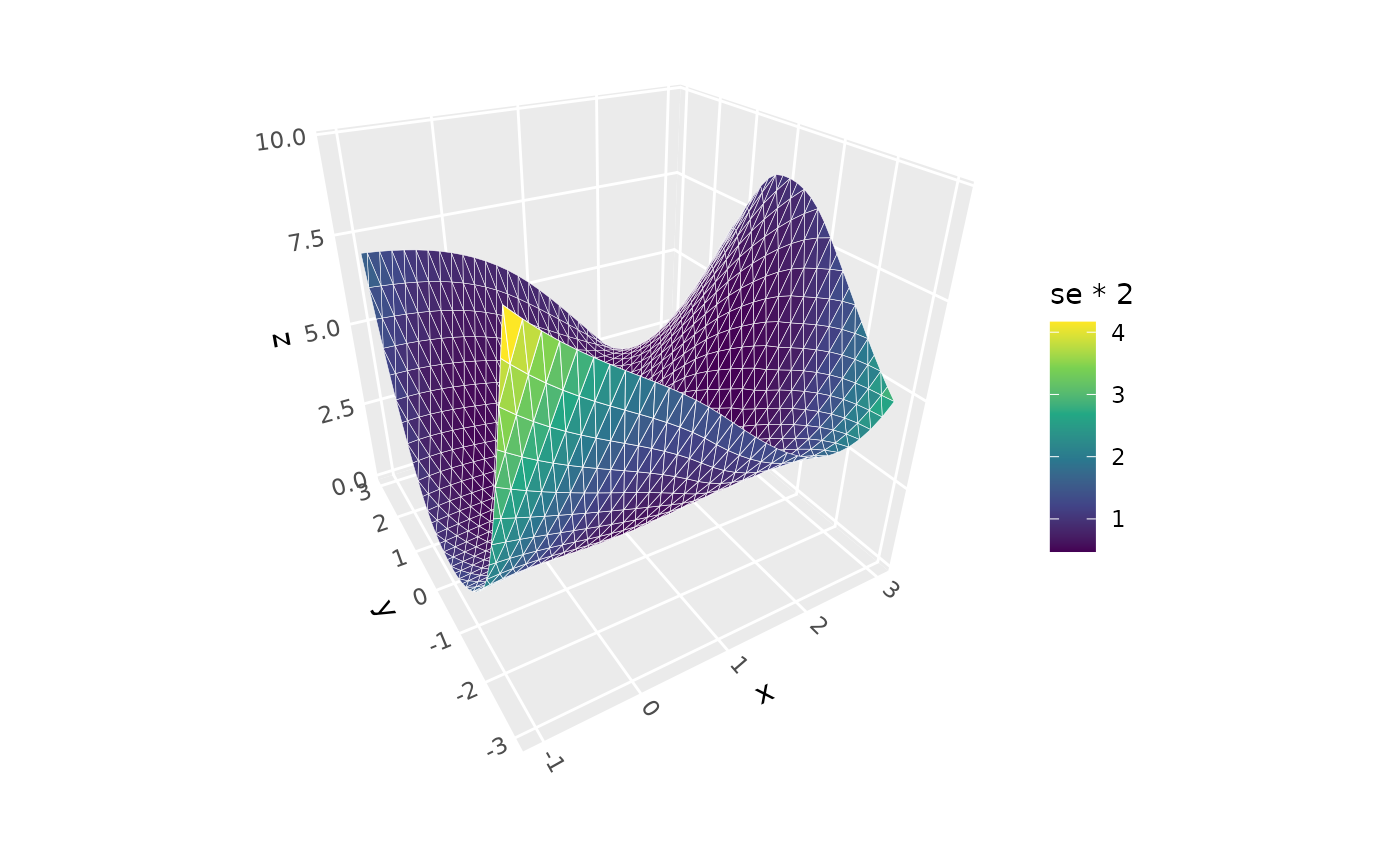
 # Visualize uncertainty with computed "standard error" variable
p + geom_smooth_3d(aes(fill = after_stat(se * 2))) +
scale_fill_viridis_c()
#> Scale for fill is already present.
#> Adding another scale for fill, which will replace the existing scale.
# Visualize uncertainty with computed "standard error" variable
p + geom_smooth_3d(aes(fill = after_stat(se * 2))) +
scale_fill_viridis_c()
#> Scale for fill is already present.
#> Adding another scale for fill, which will replace the existing scale.
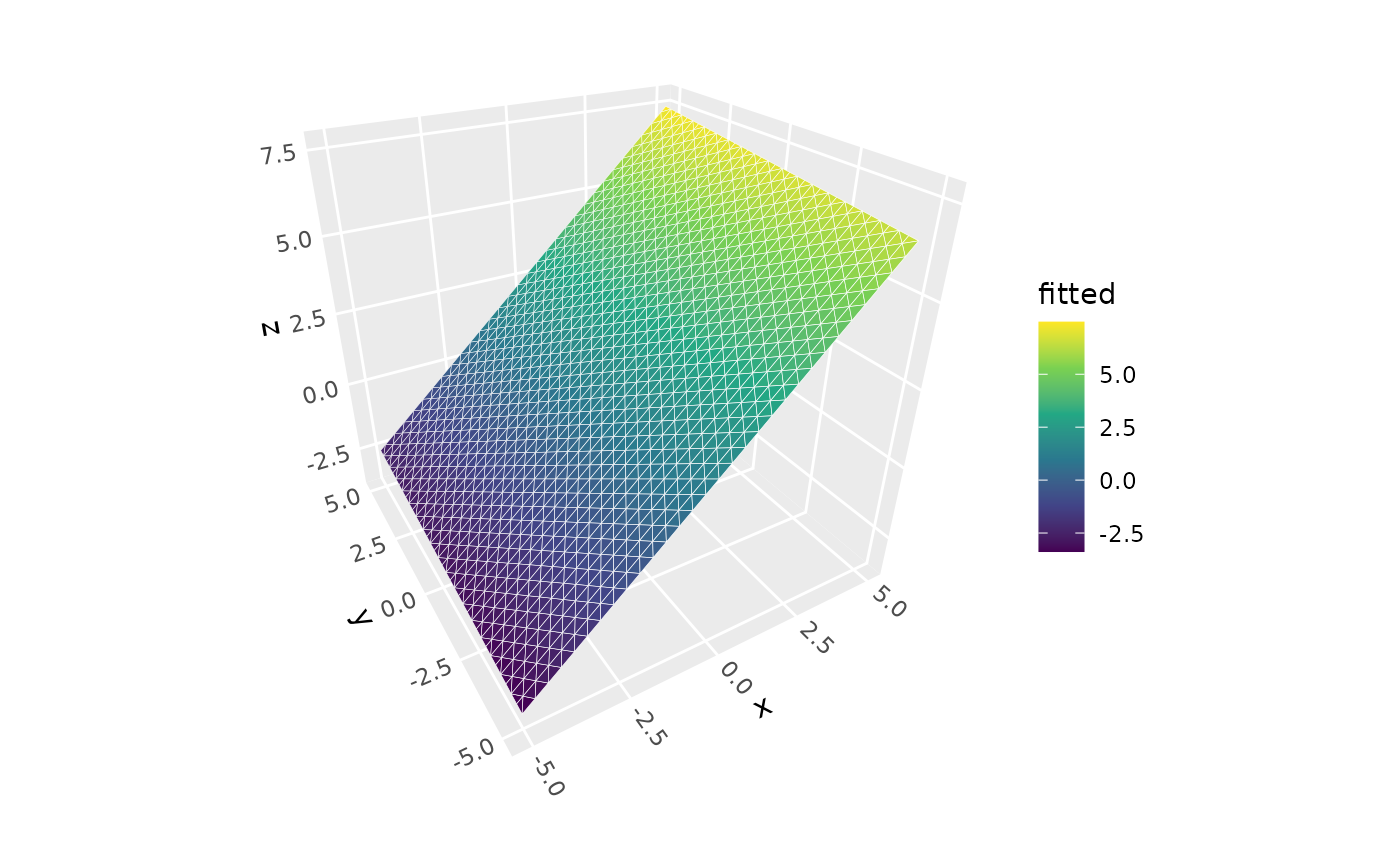
 # Extend surface beyond training data range (explicit extrapolation)
p + geom_smooth_3d(method = "lm", xlim = c(-5, 5), ylim = c(-5, 5))
# Extend surface beyond training data range (explicit extrapolation)
p + geom_smooth_3d(method = "lm", xlim = c(-5, 5), ylim = c(-5, 5))
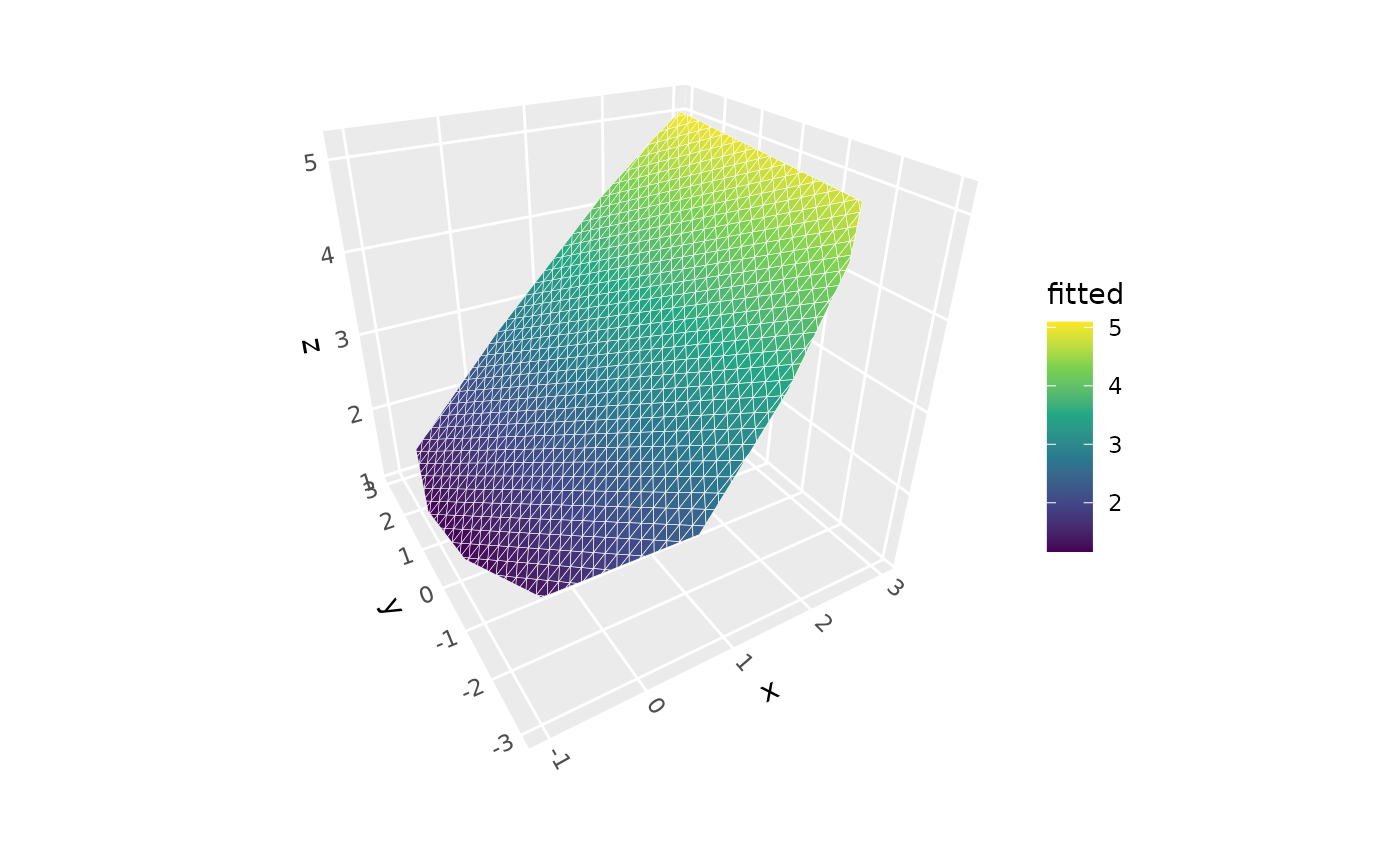
 # Clip surface to predictor convex hull
# to prevent extrapolation into corner areas
p + geom_smooth_3d(method = "lm", domain = "chull")
# Clip surface to predictor convex hull
# to prevent extrapolation into corner areas
p + geom_smooth_3d(method = "lm", domain = "chull")
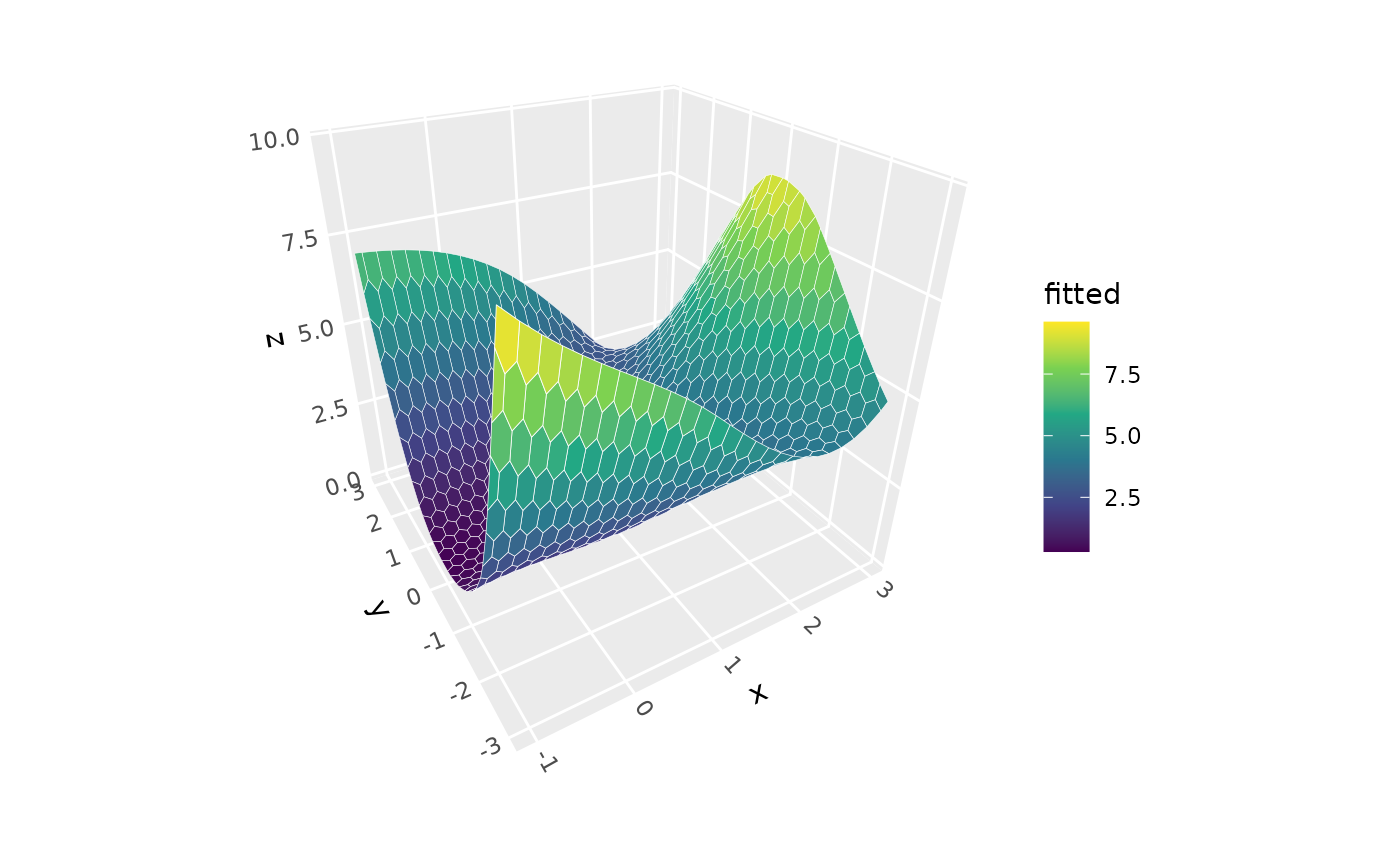
 # Specify alternative grid geometry
p + geom_smooth_3d(grid = "right1", n = 30, direction = "y")
# Specify alternative grid geometry
p + geom_smooth_3d(grid = "right1", n = 30, direction = "y")
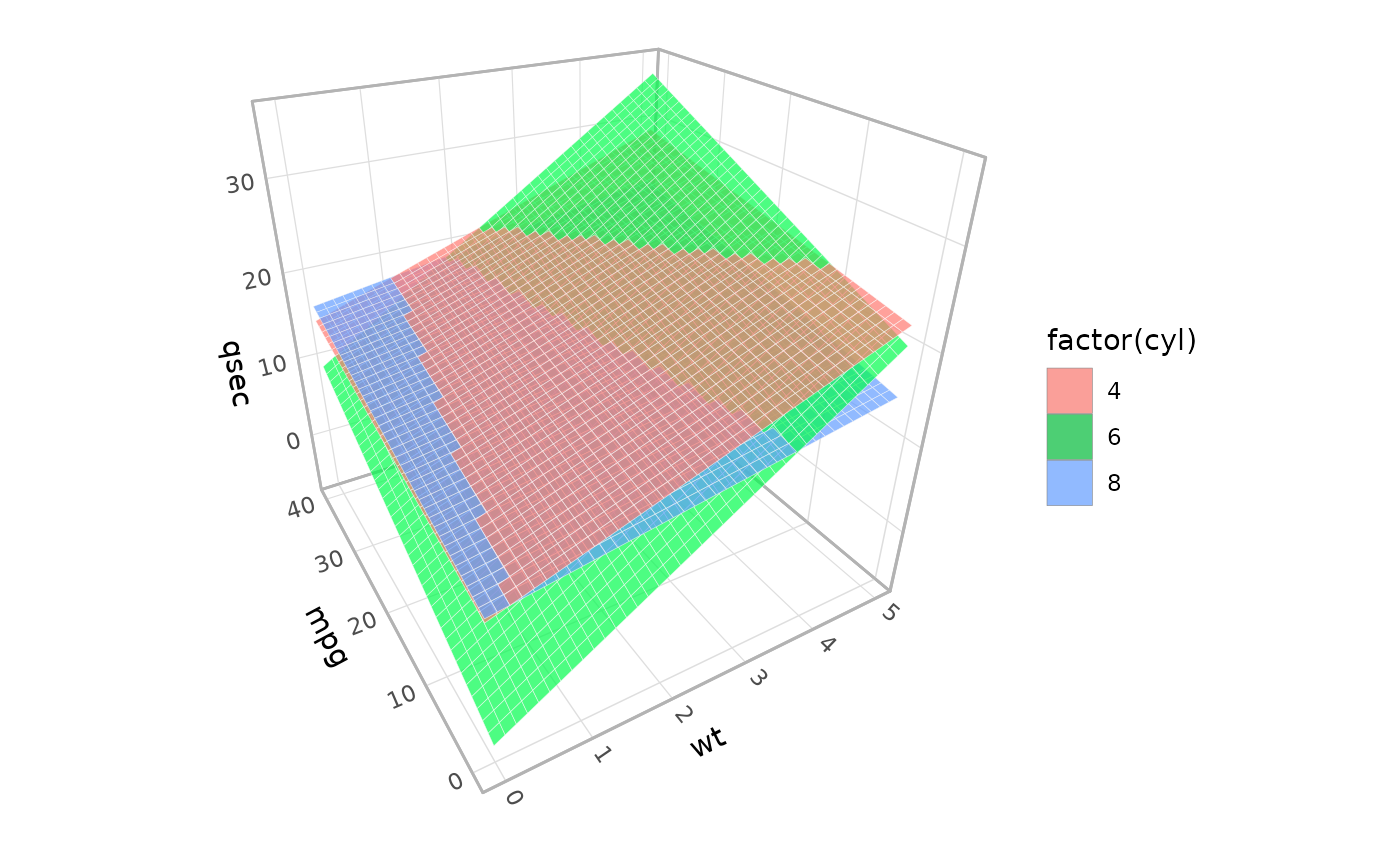
 # Separate fits for data subgroups
ggplot(mtcars, aes(wt, mpg, qsec, fill = factor(cyl))) +
geom_smooth_3d(method = "lm", alpha = .7,
xlim = c(0, 5), ylim = c(0, 40)) + # specify shared domain
coord_3d() + theme_light()
# Separate fits for data subgroups
ggplot(mtcars, aes(wt, mpg, qsec, fill = factor(cyl))) +
geom_smooth_3d(method = "lm", alpha = .7,
xlim = c(0, 5), ylim = c(0, 40)) + # specify shared domain
coord_3d() + theme_light()
 # }
# }