Evaluates a function f(x,y) = z over a regular grid and renders the result as a 3D surface or ridgeline plot.
Usage
stat_function_3d(
  mapping = NULL,
  data = ensure_nonempty_data,
  geom = "surface_3d",
  position = "identity",
  ...,
  fun = NULL,
  xlim = NULL,
  ylim = NULL,
  grid = "rectangle",
  n = 40,
  direction = "x",
  trim = TRUE,
  cull_backfaces = FALSE,
  light = NULL,
  na.rm = FALSE,
  show.legend = NA,
  inherit.aes = TRUE
)

geom_function_3d(
  mapping = NULL,
  data = ensure_nonempty_data,
  stat = "function_3d",
  position = "identity",
  ...,
  fun = NULL,
  xlim = NULL,
  ylim = NULL,
  grid = "rectangle",
  n = 40,
  direction = "x",
  trim = TRUE,
  cull_backfaces = FALSE,
  light = NULL,
  na.rm = FALSE,
  show.legend = NA,
  inherit.aes = TRUE
)
Arguments
- mapping
Set of aesthetic mappings created by
aes(). By default, fill is mapped toafter_stat(z).- data
Ignored; this stat generates its own data.
- geom
Geom to use for rendering. Defaults to
"surface_3d"for mesh surfaces. Use"ridgeline_3d"for ridgeline rendering.- position
Position adjustment, defaults to "identity".
- ...
Other arguments passed to the layer.
- fun
Function to evaluate. Must accept (x, y) and return numeric z values.
- xlim, ylim
Length-2 numeric vectors giving the x and y ranges over which to plot the function.
- grid, n, direction, trim
Parameters determining the geometry, resolution, and orientation of the surface grid. See grid_generation for details.
- cull_backfaces
Logical indicating whether to remove back-facing polygons from rendering. This is primarily for performance optimization but may be useful for aesthetic reasons in some situations. Backfaces are determined using screen-space winding order after 3D transformation. Defaults vary by geometry type: FALSE for open surface-type geometries, TRUE for solid objects (hulls, voxels, etc. where backfaces are generally hidden unless frontfaces are transparent or explicitly disabled).
- light
A lighting specification object created by
light(),"none"to disable lighting, orNULLto inherit plot-level lighting specs from the coord. Specify plot-level lighting incoord_3d()and layer-specific lighting ingeom_*3d()functions.- na.rm
If
FALSE, missing values are removed.- show.legend
Logical indicating whether this layer should be included in legends.
- inherit.aes
If
FALSE, overrides the default aesthetics.- stat
Statistical transformation to use on the data. Defaults to
"surface_3d".
Computed variables
- x, y, z
Grid coordinates and function values
- dzdx, dzdy
Partial derivatives at each point
- slope
Gradient magnitude: sqrt(dzdx^2 + dzdy^2)
- aspect
Direction of steepest slope: atan2(dzdy, dzdx)
Examples
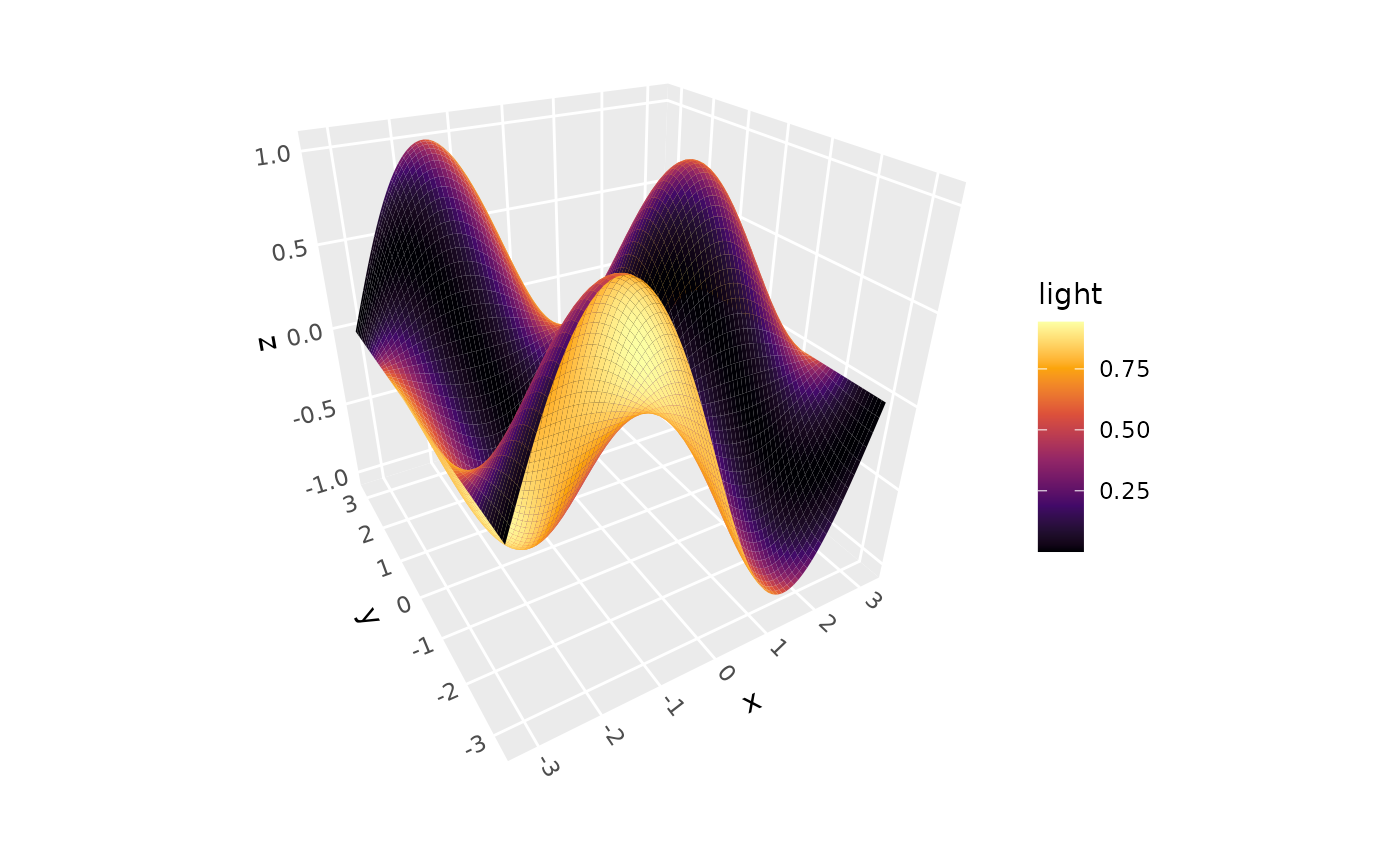
# Basic function surface
ggplot() +
geom_function_3d(fun = function(x, y) sin(x) * cos(y),
xlim = c(-pi, pi), ylim = c(-pi, pi)) +
coord_3d()
 # \donttest{
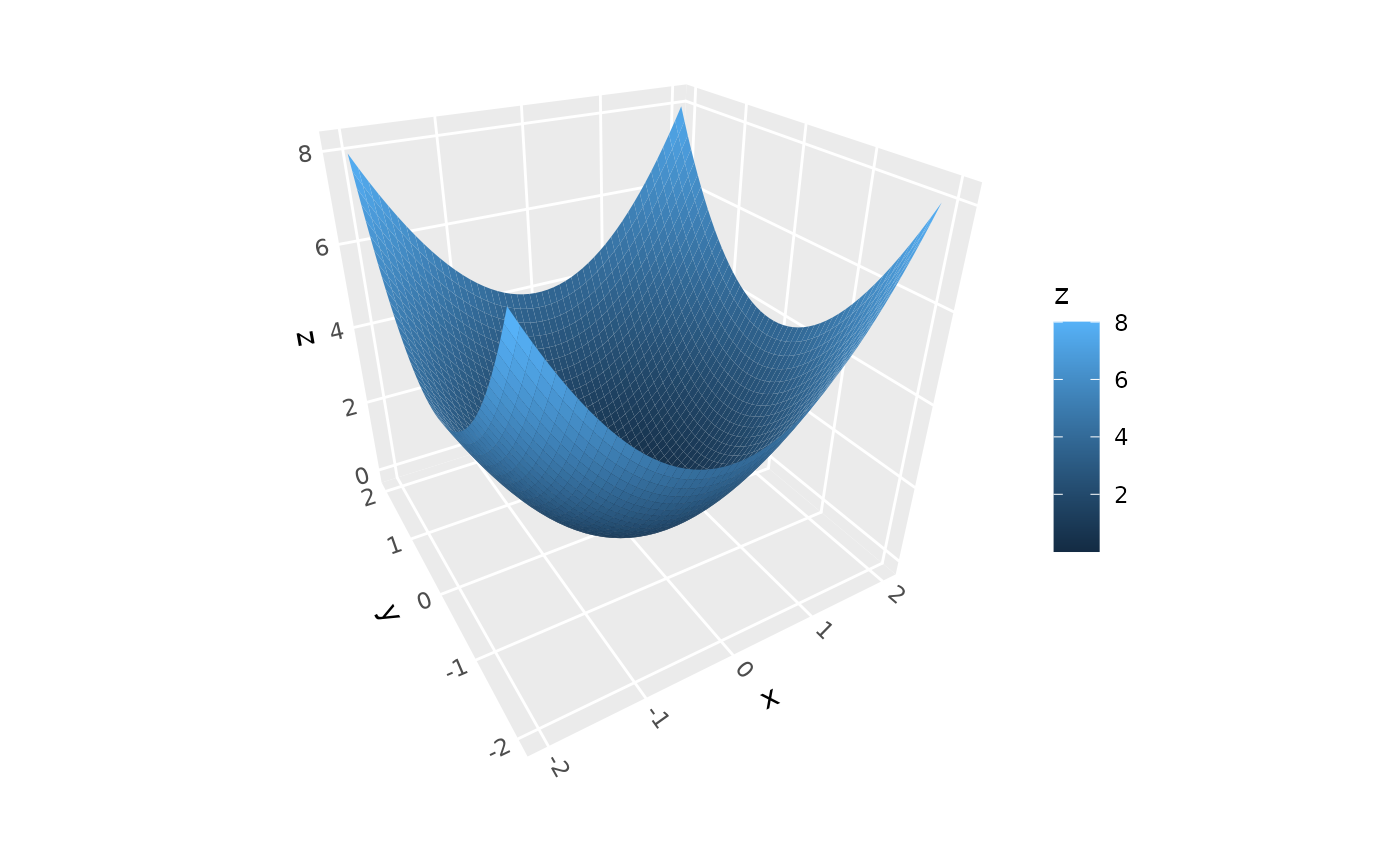
# Fill by slope
ggplot() +
geom_function_3d(fun = function(x, y) x^2 + y^2,
xlim = c(-2, 2), ylim = c(-2, 2),
aes(fill = after_stat(slope)),
grid = "equilateral") +
scale_fill_viridis_c() +
coord_3d()
# \donttest{
# Fill by slope
ggplot() +
geom_function_3d(fun = function(x, y) x^2 + y^2,
xlim = c(-2, 2), ylim = c(-2, 2),
aes(fill = after_stat(slope)),
grid = "equilateral") +
scale_fill_viridis_c() +
coord_3d()
 # As ridgelines
ggplot() +
stat_function_3d(fun = function(x, y) dnorm(x) * dnorm(y) * 10,
xlim = c(-1.5, 1.5), ylim = c(-1.5, 1.5), n = c(15, 30),
geom = "ridgeline_3d", base = 0, light = "none",
fill = "black", color = "white") +
coord_3d()
# As ridgelines
ggplot() +
stat_function_3d(fun = function(x, y) dnorm(x) * dnorm(y) * 10,
xlim = c(-1.5, 1.5), ylim = c(-1.5, 1.5), n = c(15, 30),
geom = "ridgeline_3d", base = 0, light = "none",
fill = "black", color = "white") +
coord_3d()
 # }
# }