A 3D version of ggplot2::stat_function().
Creates surfaces by evaluating a function f(x,y) = z over a regular grid.
The function is evaluated at each grid point and the resulting surface is rendered
as a 3D surface.
Usage
geom_function_3d(
  mapping = NULL,
  data = NULL,
  stat = StatFunction3D,
  position = "identity",
  ...,
  fun = NULL,
  xlim = NULL,
  ylim = NULL,
  n = NULL,
  grid = NULL,
  direction = NULL,
  trim = NULL,
  light = NULL,
  cull_backfaces = FALSE,
  sort_method = NULL,
  force_convex = TRUE,
  scale_depth = TRUE,
  na.rm = FALSE,
  show.legend = NA,
  inherit.aes = TRUE
)

stat_function_3d(
  mapping = NULL,
  data = NULL,
  geom = GeomPolygon3D,
  position = "identity",
  ...,
  fun = NULL,
  xlim = NULL,
  ylim = NULL,
  n = NULL,
  grid = NULL,
  direction = NULL,
  trim = NULL,
  cull_backfaces = FALSE,
  sort_method = NULL,
  force_convex = TRUE,
  scale_depth = TRUE,
  light = NULL,
  na.rm = FALSE,
  show.legend = NA,
  inherit.aes = TRUE
)
Arguments
- mapping
Set of aesthetic mappings created by
aes(). Since this stat generates its own data, typically only used for additional aesthetics likefillorcolorbased on computed variables. Fill is mapped toafter_stat(z)by default.- data
The data to be displayed in this layer. Usually not needed since the stat generates its own data from the function.
- stat
The statistical transformation to use on the data. Defaults to
StatFunction3D.- position
Position adjustment, defaults to "identity". To collapse the result onto one 2D surface, use
position_on_face().- ...
Other arguments passed on to the the layer function (typically GeomPolygon3D), such as aesthetics like
colour,fill,linewidth, etc.- fun
Function to evaluate. Must accept two arguments (vectors corresponding to x and y axis values) and return a numeric vector of z values. Required parameter.
- xlim, ylim
Numeric vectors of length 2 giving the range for x and y values. If
NULL(default), uses the scale ranges from the plot, which can be set viaxlim()andylim(), or trained by supplying data to the plot.- grid, n, direction, trim
Parameters determining the geometry, resolution, and orientation of the surface grid. See grid_generation for details.
- light
A lighting specification object created by
light()(see that function for details), orNULLto disable shading. Specify plot-level lighting incoord_3d()and layer-specific lighting ingeom_*3d()functions.- cull_backfaces, sort_method, force_convex, scale_depth
Advanced polygon rendering parameters. See polygon_rendering for details.
- na.rm
If
FALSE, missing values are removed.- show.legend
Logical indicating whether this layer should be included in legends.
- inherit.aes
If
FALSE, overrides the default aesthetics.- geom
The geometric object used to display the data. Defaults to
GeomPolygon3D.
Aesthetics
stat_function_3d() generates its own x, y, z coordinates, so typically no
positional aesthetics are needed in the mapping. However, you can use computed
variables with after_stat().
Computed variables
The following computed variables are available via after_stat():
x,y,z: Grid coordinates and function valuesnormal_x,normal_y,normal_z: Surface normal componentsslope: Gradient magnitude from surface calculationsaspect: Direction of steepest slope from surface calculationsdzdx,dzdy: Partial derivatives from surface calculation
See also
stat_surface_3d() for surfaces from existing grid data,
make_tile_grid() for details about grid geometry options,
light() for lighting specifications,
coord_3d() for 3D coordinate systems.
Examples
library(ggplot2)
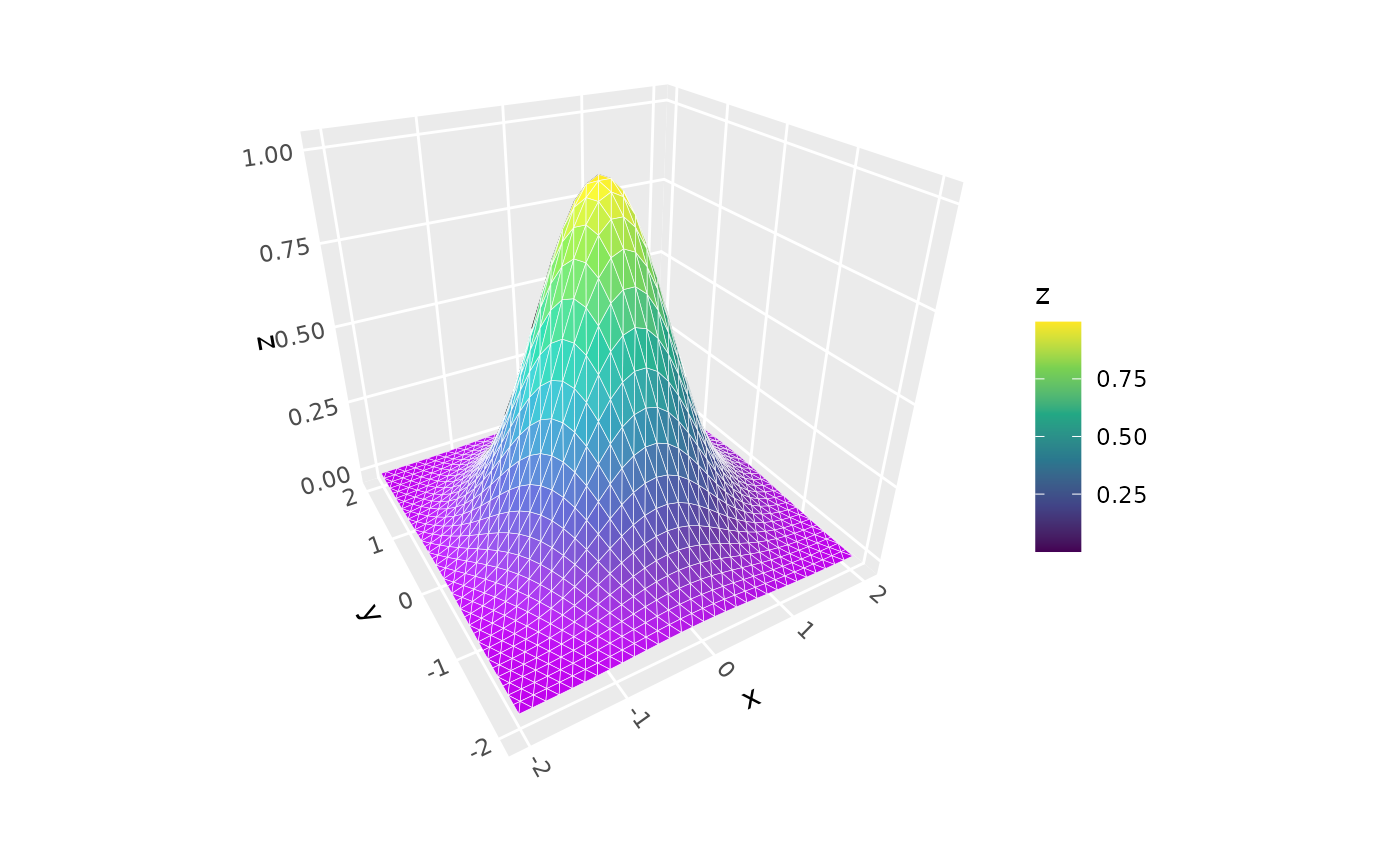
# Basic function surface
ggplot() +
geom_function_3d(fun = function(a, b) exp(-(a^2 + b^2)),
xlim = c(-2, 2), ylim = c(-2, 2),
light = NULL, color = "white") +
coord_3d() +
scale_fill_viridis_c()
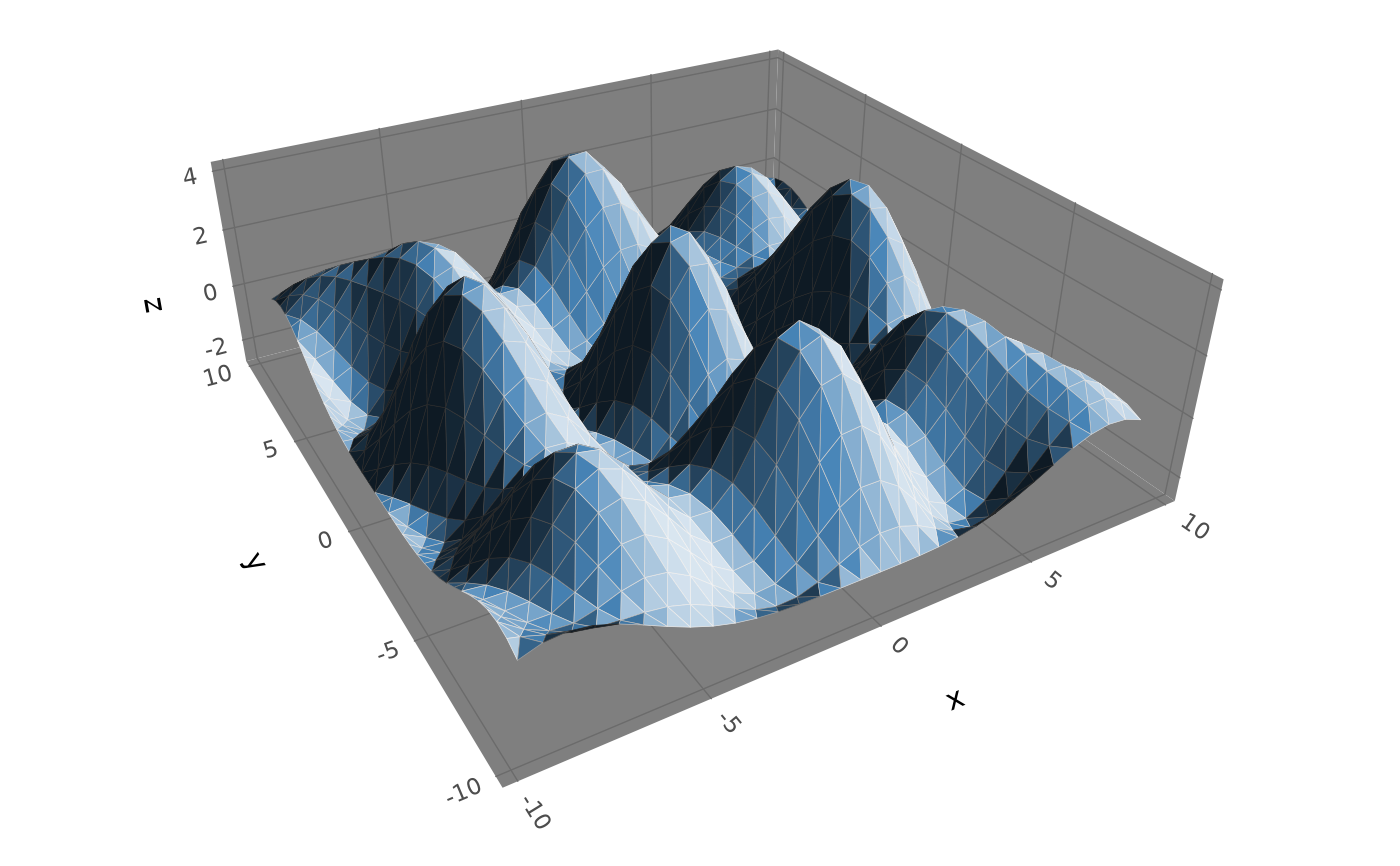
 # Wave function with lighting
wave_fun <- function(x, y) cos(x) + cos(y) + cos(x+y) + cos(sqrt(x^2 + y^2))
ggplot() +
geom_function_3d(fun = wave_fun, fill = "steelblue",
xlim = c(-3*pi, 3*pi), ylim = c(-3*pi, 3*pi),
light = light(method = "direct", mode = "hsl",
contrast = .8, direction = c(1, -1, 1))) +
coord_3d(scales = "fixed") + theme_dark()
# Wave function with lighting
wave_fun <- function(x, y) cos(x) + cos(y) + cos(x+y) + cos(sqrt(x^2 + y^2))
ggplot() +
geom_function_3d(fun = wave_fun, fill = "steelblue",
xlim = c(-3*pi, 3*pi), ylim = c(-3*pi, 3*pi),
light = light(method = "direct", mode = "hsl",
contrast = .8, direction = c(1, -1, 1))) +
coord_3d(scales = "fixed") + theme_dark()
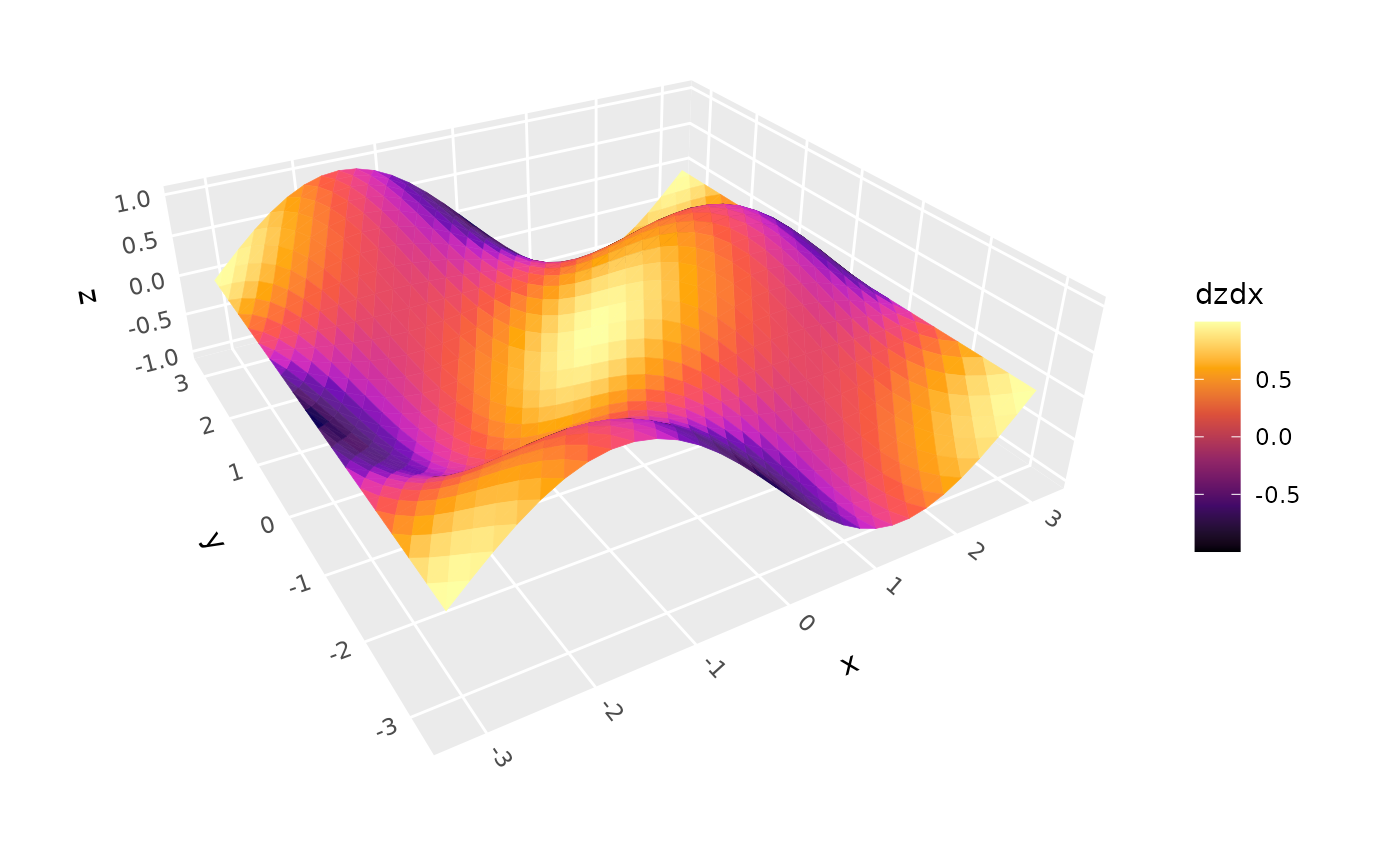
 # Use after_stat to access computed surface-orientation variables
ggplot() +
geom_function_3d(aes(fill = after_stat(dzdx),
color = after_stat(dzdx)),
fun = function(x, y) sin(x) * cos(y),
xlim = c(-pi, pi), ylim = c(-pi, pi),
light = NULL) +
scale_fill_viridis_c(option = "B") +
scale_color_viridis_c(option = "B") +
coord_3d(scales = "fixed")
# Use after_stat to access computed surface-orientation variables
ggplot() +
geom_function_3d(aes(fill = after_stat(dzdx),
color = after_stat(dzdx)),
fun = function(x, y) sin(x) * cos(y),
xlim = c(-pi, pi), ylim = c(-pi, pi),
light = NULL) +
scale_fill_viridis_c(option = "B") +
scale_color_viridis_c(option = "B") +
coord_3d(scales = "fixed")
 # Use "filtering" functions to constrain output domain
ggplot() +
geom_function_3d(fun = function(a, b) {
ifelse(sqrt(a^2 + b^2) < 2, exp(-(a^2 + b^2)), NA)},
xlim = c(-2, 2), ylim = c(-2, 2), color = "white") +
coord_3d() +
scale_fill_viridis_c() +
guides(fill = guide_colorbar_3d())
#> Warning: Removed 1515 rows containing missing values or values outside the scale range
#> (`geom_polygon3d()`).
# Use "filtering" functions to constrain output domain
ggplot() +
geom_function_3d(fun = function(a, b) {
ifelse(sqrt(a^2 + b^2) < 2, exp(-(a^2 + b^2)), NA)},
xlim = c(-2, 2), ylim = c(-2, 2), color = "white") +
coord_3d() +
scale_fill_viridis_c() +
guides(fill = guide_colorbar_3d())
#> Warning: Removed 1515 rows containing missing values or values outside the scale range
#> (`geom_polygon3d()`).
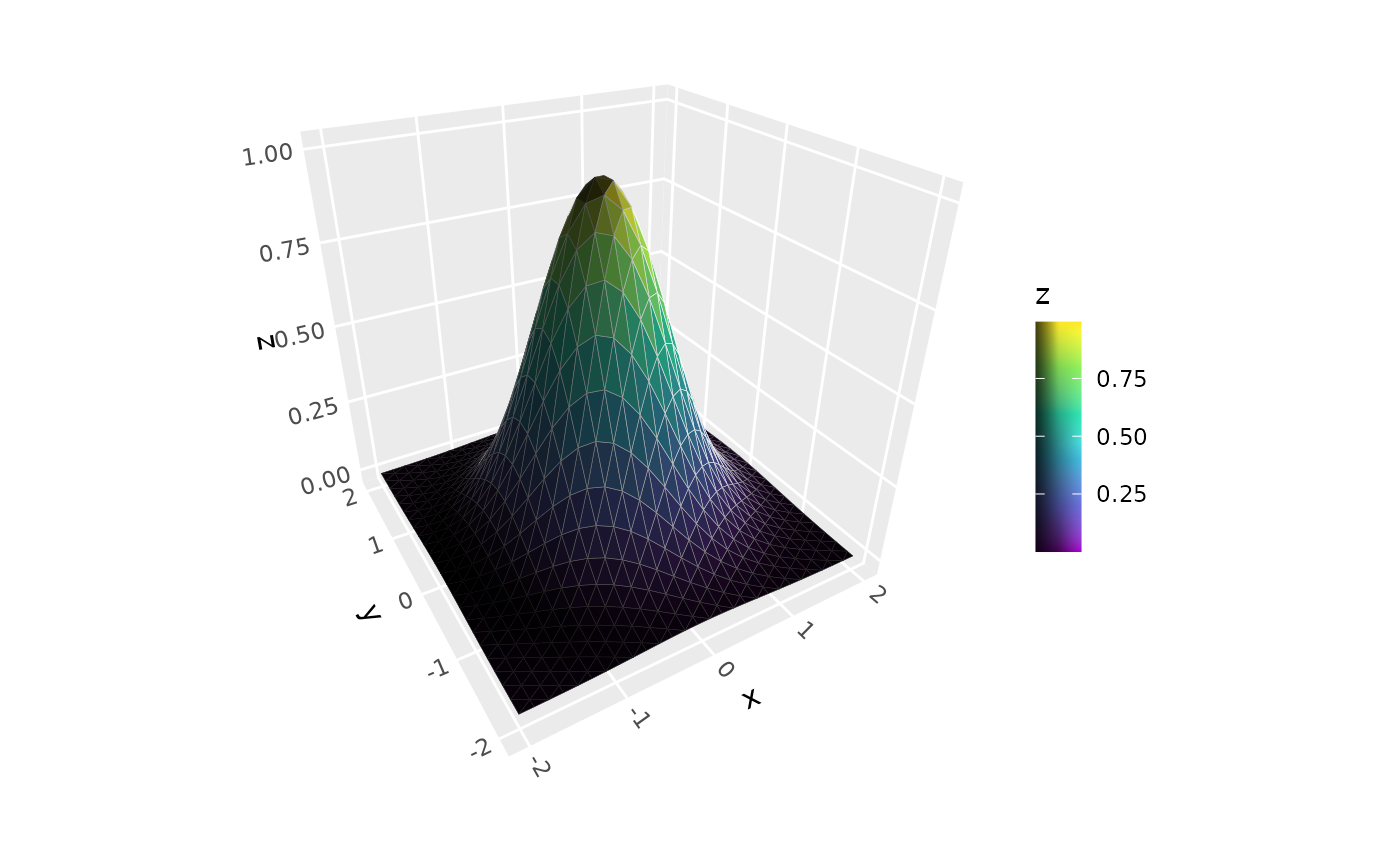
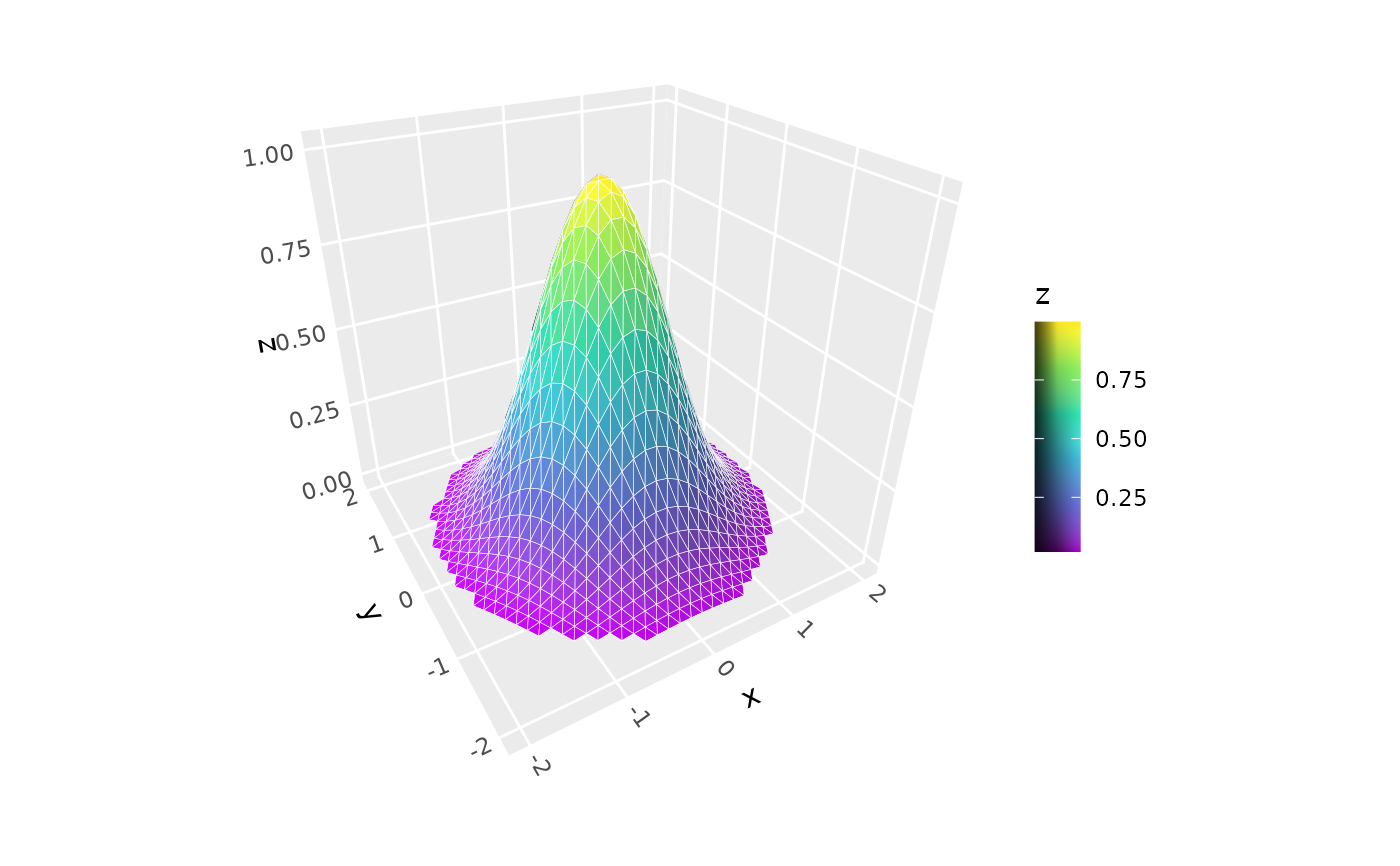 # Specify alternative grid geometry
ggplot() +
geom_function_3d(fun = function(a, b) exp(-(a^2 + b^2)),
xlim = c(-2, 2), ylim = c(-2, 2), color = "white",
grid = "tri", n = 30, direction = "y") +
coord_3d() +
scale_fill_viridis_c() +
guides(fill = guide_colorbar_3d())
# Specify alternative grid geometry
ggplot() +
geom_function_3d(fun = function(a, b) exp(-(a^2 + b^2)),
xlim = c(-2, 2), ylim = c(-2, 2), color = "white",
grid = "tri", n = 30, direction = "y") +
coord_3d() +
scale_fill_viridis_c() +
guides(fill = guide_colorbar_3d())