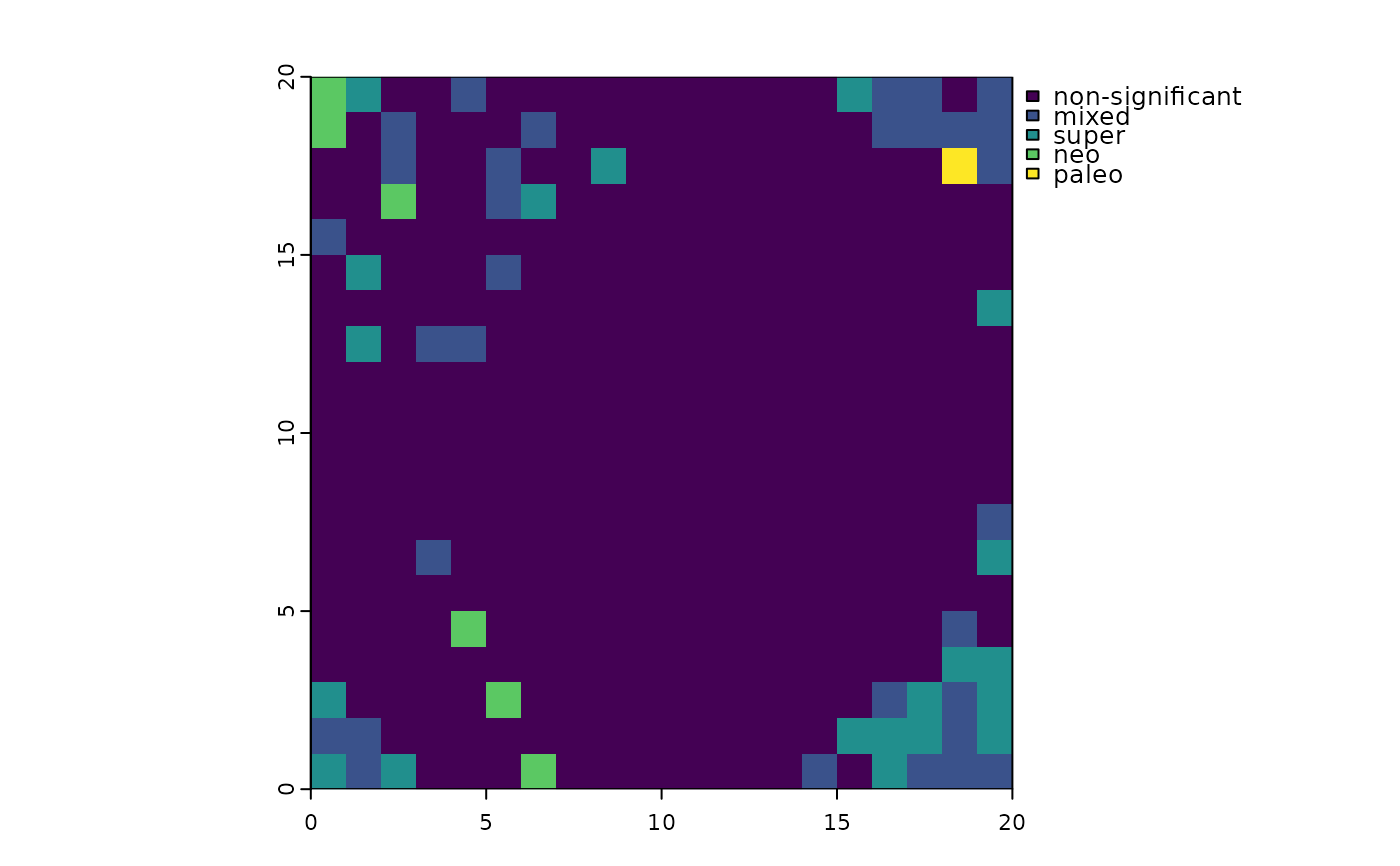
This function classifies sites into areas of significant endemism according to the scheme of Mishler et al. (2014). Categorization is based on randomization quantile values for PE, RPE, and CE (which Mishler et al. call "PE on the comparison tree").
Value
An object of the same class as rand containing a variable called "canape", with values 0-4
corresponding to not-significant, mixed-, super-, neo-, and paleo-endemism, respectively.
Details
Endemism significance categories are defined as follows:
Endemism not significant: neither PE nor CE are significantly high at
alpha.Significant neoendemism: PE or CE are significantly high at
alpha; RPE significantly low atalpha / 2(two-tailed test).Significant paleoendemism: PE or CE are significantly high at
alpha; RPE significantly high atalpha / 2(two-tailed test)..Significant mixed-endemism: PE or CE are significantly high at
alpha; RPE not significant.Significant super-endemism: PE or CE are significantly high at
alpha / 5; RPE not significant.
References
Mishler, B. D., Knerr, N., González-Orozco, C. E., Thornhill, A. H., Laffan, S. W., & Miller, J. T. (2014). Phylogenetic measures of biodiversity and neo-and paleo-endemism in Australian Acacia. Nature Communications, 5(1), 4473.
Examples
# \donttest{
# classic CANAPE using binary data and the curveball algorithm
# (note that a real analysis would require a much higher `n_rand`)
set.seed(123456)
ps <- ps_simulate(data_type = "binary")
rand <- ps_rand(ps, metric = c("PE", "RPE", "CE"),
                fun = "nullmodel", method = "curveball",
                n_rand = 25, burnin = 10000, progress = FALSE)
canape <- ps_canape(rand)
terra::plot(canape)

# }
# }
