Plot a phylospatial object
Arguments
- x
phylospatialobject- y
Either
"tree"or"comm", indicating which component to plot.- max_taxa
Integer giving the maximum number of taxon ranges to plot if
y = "tree".- ...
Additional arguments passed to plotting methods, depending on
yand the class ofx$spatial. Fory = "tree", see plot.phylo; fory = "comm", see plot or plot.sf.
Examples
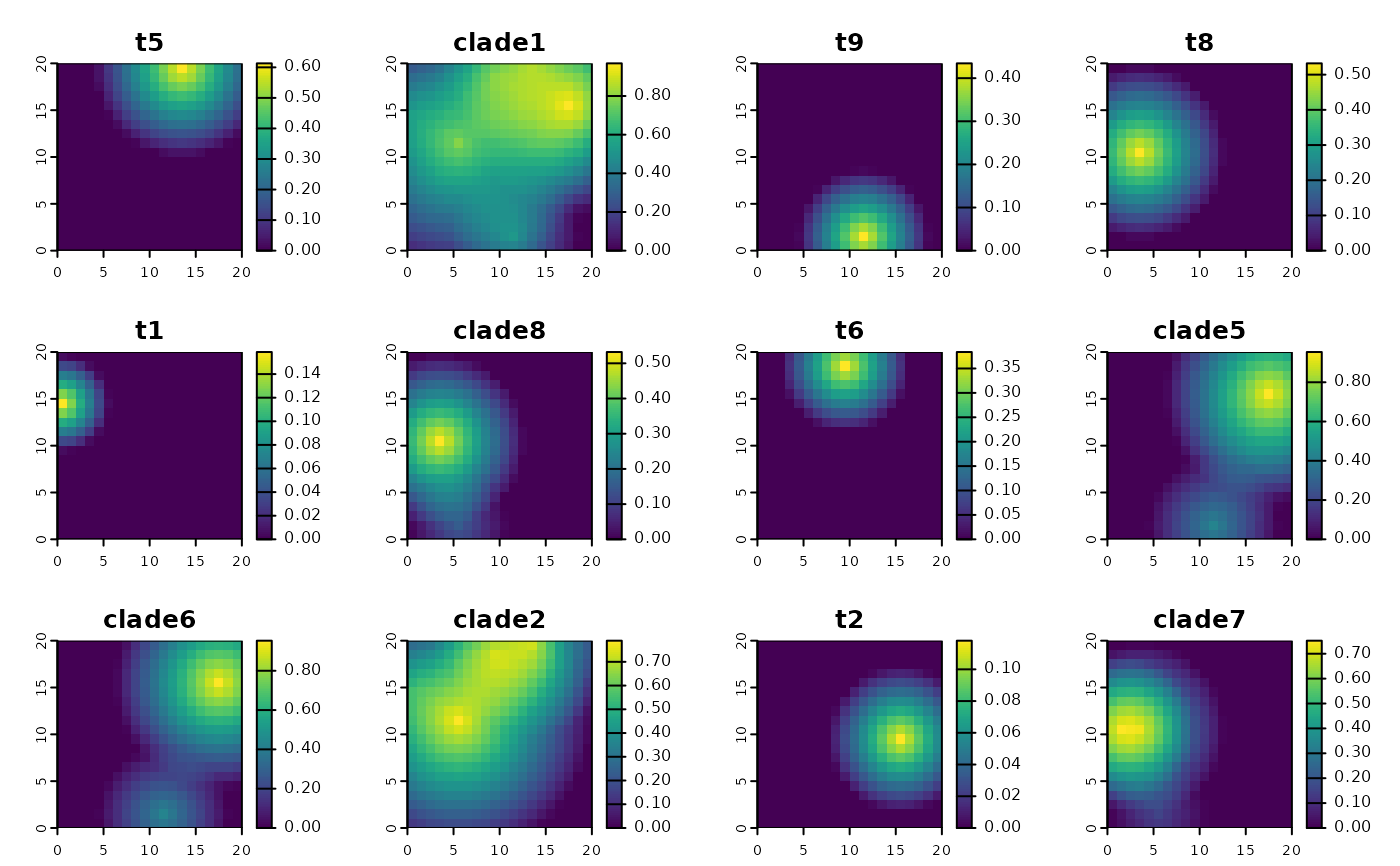
ps <- ps_simulate(20, 20, 20)
plot(ps, "tree")

plot(ps, "comm")