stat_hull_3d() turns 3D point clouds into surface hulls consisting of triangular polygons,
using either convex hull or alpha shape algorithms. It computes surface normals and applies
various lighting models to create realistic 3D surface visualizations.
Usage
stat_hull_3d(
  mapping = NULL,
  data = NULL,
  geom = GeomPolygon3D,
  position = "identity",
  method = "convex",
  alpha = 1,
  light = lighting(),
  inherit.aes = TRUE,
  ...
)
Arguments
- mapping
Set of aesthetic mappings created by
aes(). The required aesthetics arex,y, andz. Additional aesthetics can use computed variables withafter_stat().- data
The data to be displayed in this layer.
- geom
The geometric object to use display the data. Defaults to GeomPolygon3D for proper 3D depth sorting.
- position
Position adjustment, defaults to "identity".
- method
Triangulation method. Either:
"convex": Convex hull triangulation (works well for convex shapes like spheres, default)"alpha": Alpha shape triangulation (can capture non-convex topologies like toruses)
- alpha
Alpha parameter for alpha shape triangulation. IMPORTANT: Alpha shapes are extremely sensitive to the coordinate scales of your data. See Details section.
- light
A lighting specification object created by
lighting()- inherit.aes
If
FALSE, overrides the default aesthetics.- ...
Other arguments passed on to
layer().
Grouping
stat_hull_3d() respects ggplot2 grouping aesthetics. To create separate hulls for different
subsets of your data, use aes(group = category_variable) or similar grouping aesthetics.
Each group will get its own independent hull calculation.
Alpha scale sensitivity
Alpha shape method is highly sensitive to coordinate scales. The alpha parameter
that works for data scaled 0-1 will likely fail for data scaled 0-1000.
Guidelines for choosing alpha:
Start with
alpha = 1.0and adjust based on resultsFor data with mixed scales (e.g., x: 0-1, y: 0-1000), consider rescaling your data first
Larger alpha values → smoother, more connected surfaces
Smaller alpha values → more detailed surfaces, but may fragment
If you get no triangles, try increasing alpha by 10x
If surface fills unwanted holes, try decreasing alpha by 10x
Example scale effects:
# These require very different alpha values:
data_small <- data.frame(x = runif(100, 0, 1), y = runif(100, 0, 1), z = runif(100, 0, 1))
data_large <- data.frame(x = runif(100, 0, 100), y = runif(100, 0, 100), z = runif(100, 0, 100))

stat_hull_3d(data = data_small, alpha = 0.5)    # Might work well
stat_hull_3d(data = data_large, alpha = 50)     # Might need much larger alpha
Computed variables
light: Computed lighting value (numeric for most methods, hex color fornormal_rgb)normal_x,normal_y,normal_z: Surface normal componentstriangle_index: Sequential triangle number (useful for debugging)face_id: Triangle group identifier
Aesthetics
stat_hull_3d() requires the following aesthetics:
x: X coordinate
y: Y coordinate
z: Z coordinate
Computed variables can be accessed using after_stat():
after_stat(light): Lighting valuesafter_stat(normal_x): X component of surface normalafter_stat(normal_y): Y component of surface normalafter_stat(normal_z): Z component of surface normal
See also
coord_3d() for 3D coordinate systems, geom_polygon_3d for the
default geometry with depth sorting, lighting() for lighting specifications.
Examples
library(ggplot2)
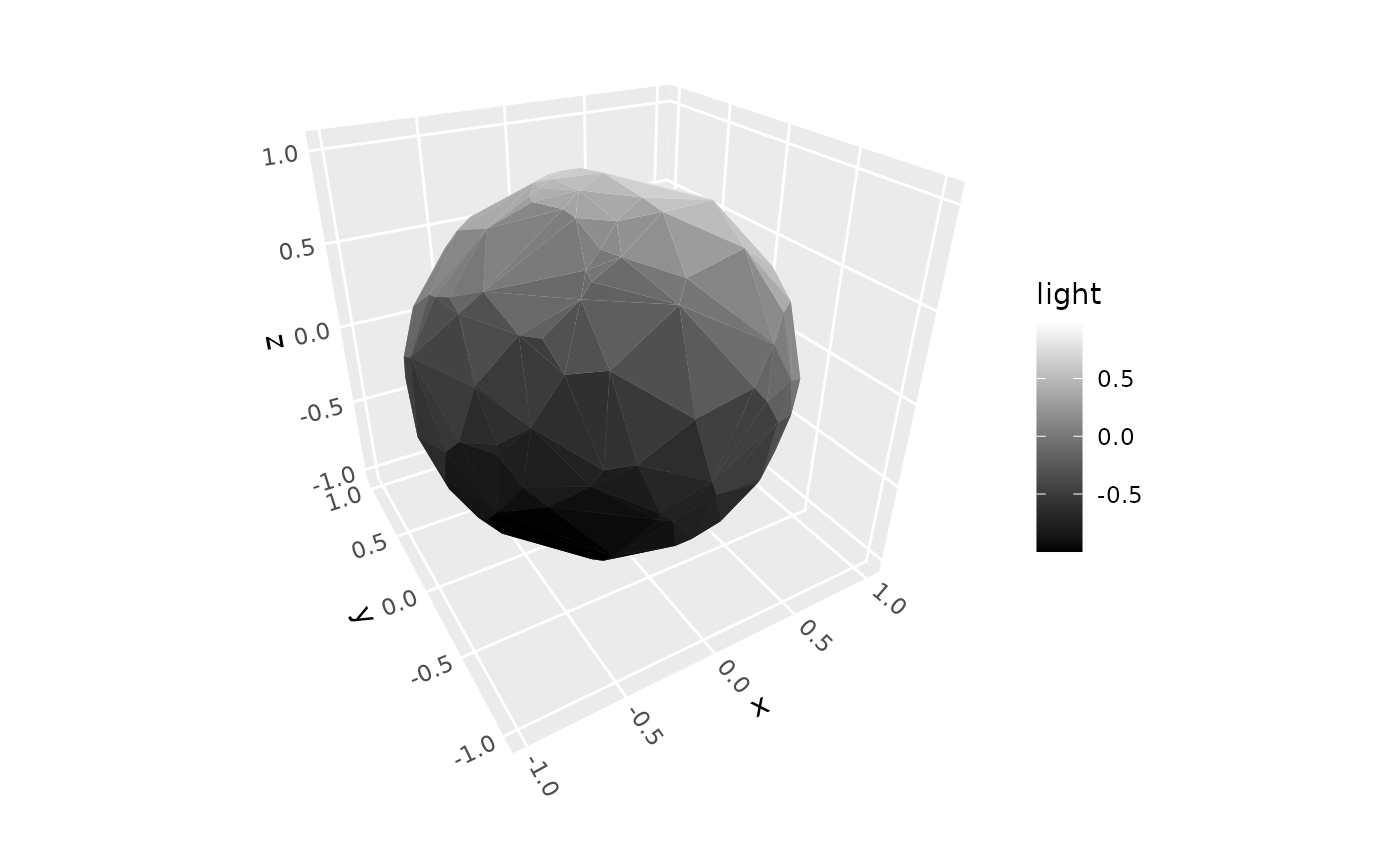
# Convex hull (reliable default, no scale sensitivity)
ggplot(sphere_points, aes(x, y, z = z)) +
stat_hull_3d(aes(fill = after_stat(light)), method = "convex") +
scale_fill_gradient(low = "black", high = "white") +
coord_3d()
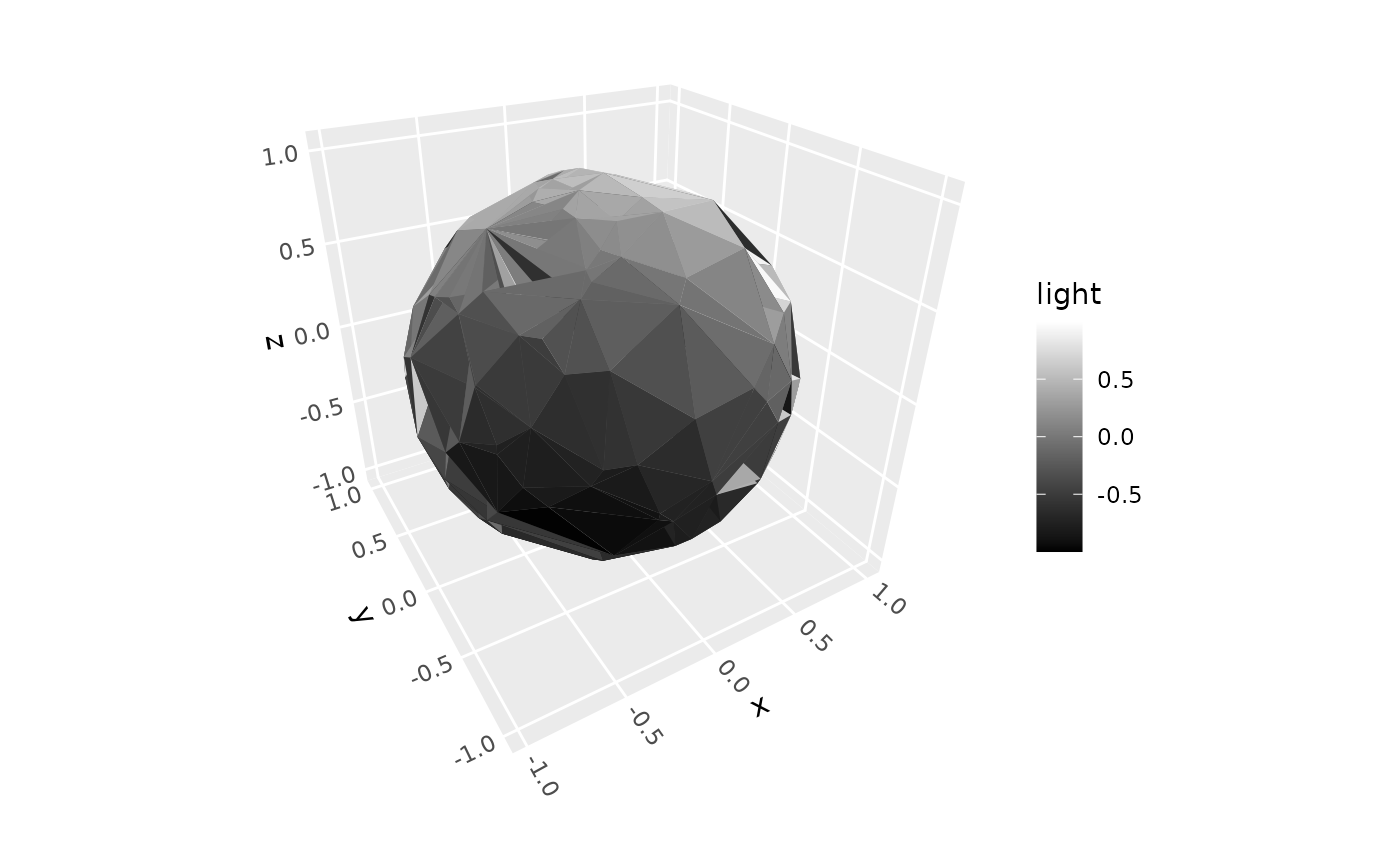
 # Alpha shape (scale-sensitive - alpha ~1 works for unit sphere)
ggplot(sphere_points, aes(x, y, z = z)) +
stat_hull_3d(aes(fill = after_stat(light)), method = "alpha", alpha = 1.0) +
scale_fill_gradient(low = "black", high = "white") +
coord_3d()
# Alpha shape (scale-sensitive - alpha ~1 works for unit sphere)
ggplot(sphere_points, aes(x, y, z = z)) +
stat_hull_3d(aes(fill = after_stat(light)), method = "alpha", alpha = 1.0) +
scale_fill_gradient(low = "black", high = "white") +
coord_3d()
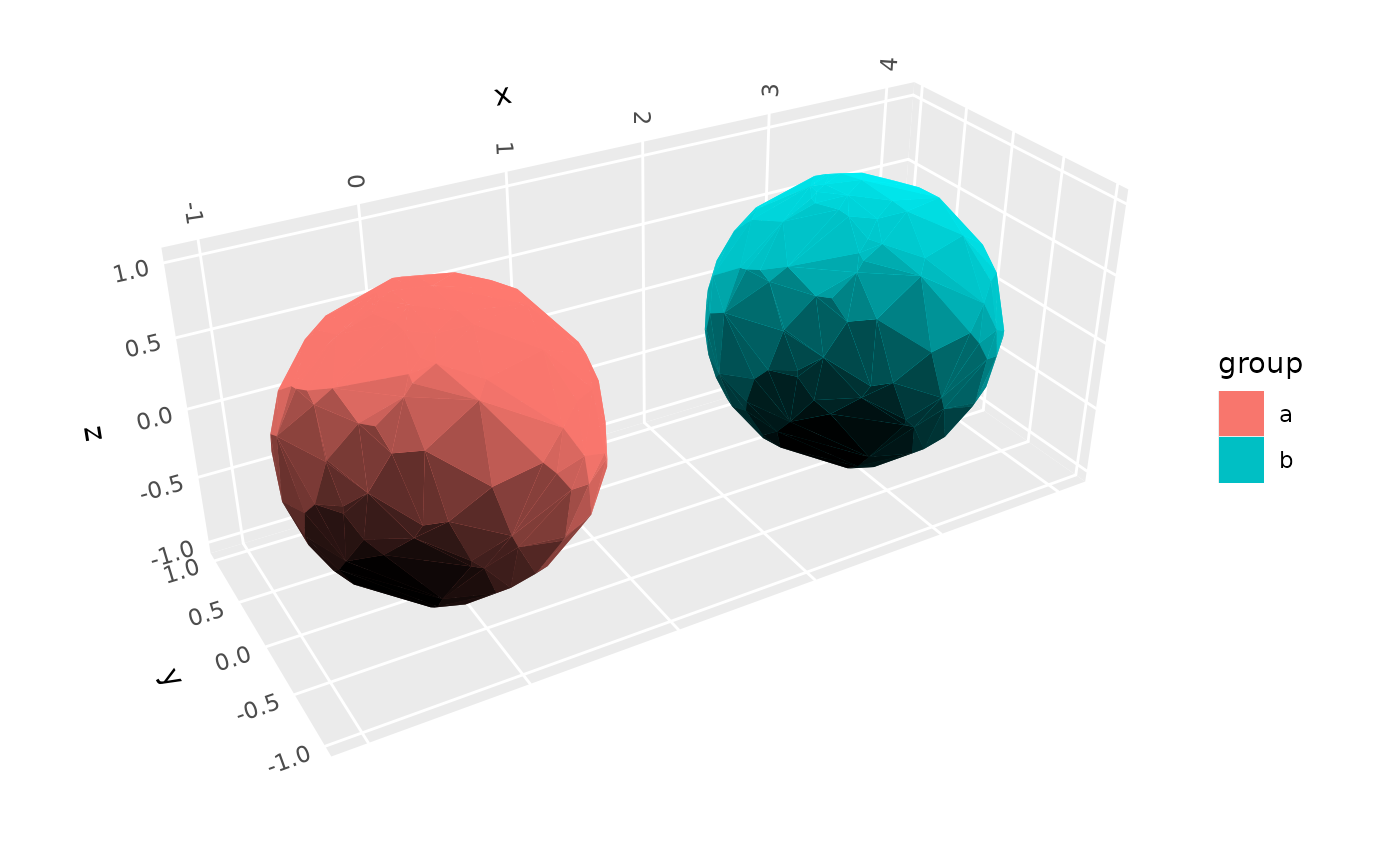
 # Grouped hulls - separate hull for each species
spheres <- rbind(dplyr::mutate(sphere_points, group = "a"),
dplyr::mutate(sphere_points, group = "b", x = x + 3))
ggplot(spheres, aes(x, y, z, group = group)) +
stat_hull_3d(aes(fill = group), light = lighting(blend = "fill")) +
coord_3d(scales = "fixed")
# Grouped hulls - separate hull for each species
spheres <- rbind(dplyr::mutate(sphere_points, group = "a"),
dplyr::mutate(sphere_points, group = "b", x = x + 3))
ggplot(spheres, aes(x, y, z, group = group)) +
stat_hull_3d(aes(fill = group), light = lighting(blend = "fill")) +
coord_3d(scales = "fixed")
 # For larger coordinate scales, increase alpha proportionally:
# sphere_large <- sphere_points * 100 # Scale up by 100x
# ggplot(sphere_large, aes(x, y, z = z)) +
# stat_hull_3d(method = "alpha", alpha = 10, # Increase alpha ~100x
# fill = "darkgreen", light = lighting(blend = "fill")) +
# coord_3d()
# For larger coordinate scales, increase alpha proportionally:
# sphere_large <- sphere_points * 100 # Scale up by 100x
# ggplot(sphere_large, aes(x, y, z = z)) +
# stat_hull_3d(method = "alpha", alpha = 10, # Increase alpha ~100x
# fill = "darkgreen", light = lighting(blend = "fill")) +
# coord_3d()