Creates 3D pillars from regular grid data in which x and y fall on a regular grid. Works with both complete and sparse grid data. Each data point becomes a rectangular 3D column extending from a base level to the data value.
Usage
geom_pillar_3d(
  mapping = NULL,
  data = NULL,
  stat = StatPillar3D,
  position = "identity",
  ...,
  width = 1,
  faces = "all",
  zmin = NULL,
  light = NULL,
  cull_backfaces = TRUE,
  sort_method = NULL,
  scale_depth = TRUE,
  force_convex = FALSE,
  na.rm = FALSE,
  show.legend = NA,
  inherit.aes = TRUE
)

stat_pillar_3d(
  mapping = NULL,
  data = NULL,
  geom = GeomPolygon3D,
  position = "identity",
  ...,
  width = 1,
  faces = "all",
  zmin = NULL,
  light = NULL,
  cull_backfaces = TRUE,
  sort_method = NULL,
  scale_depth = TRUE,
  force_convex = FALSE,
  na.rm = FALSE,
  show.legend = NA,
  inherit.aes = TRUE
)
Arguments
- mapping
Set of aesthetic mappings created by
aes().- data
The data to be displayed in this layer.
- stat
The statistical transformation to use on the data. Defaults to
StatPillar3D.- position
Position adjustment, defaults to "identity". To collapse the result onto one 2D surface, use
position_on_face().- ...
Other arguments passed on to the the layer function (typically GeomPolygon3D), such as aesthetics like
colour,fill,linewidth, etc.- width
Numeric value controlling box width as a fraction of grid spacing. Default is 1.0 (volumes touch each other). Use 0.8 for small gaps, 1.2 for overlap. Grid spacing is determined automatically using
resolution().- faces
Character vector specifying which faces to render. Options:
"all"(default): Render all 6 faces"none": Render no facesVector of face names:
c("zmax", "xmin", "ymax"), etc.
Valid face names: "xmin", "xmax", "ymin", "ymax", "zmin", "zmax". Note that this setting acts jointly with backface culling, which removes faces whose interior faces the viewer – e.g., when
cull_backfaces = TRUEandfaces = "all"(the default), only front faces are rendered.- zmin
Base level for all pillars. When provided as a parameter, overrides any
zminaesthetic mapping. IfNULL(default), uses thezminaesthetic if mapped, otherwise defaults to the minimumzvalue in the data.- light
A lighting specification object created by
light()(see that function for details), orNULLto disable shading. Specify plot-level lighting incoord_3d()and layer-specific lighting ingeom_*3d()functions.- cull_backfaces, sort_method, force_convex, scale_depth
Advanced polygon rendering parameters. See polygon_rendering for details.
- na.rm
If
FALSE, missing values are removed.- show.legend
Logical indicating whether this layer should be included in legends.
- inherit.aes
If
FALSE, overrides the default aesthetics.- geom
The geometric object used to display the data. Defaults to
GeomPolygon3D.
Details
Note that pillar geometries often require pairwise depth sorting for correct rendering.
This is the default for smaller data sets, but not for larger data sets due to compute speed;
in those cases you may wish to manually specify sort_method = "pairwise" for good results.
Aesthetics
stat_pillar_3d() requires the following aesthetics:
x: X coordinate (grid position)
y: Y coordinate (grid position)
z: Z coordinate (pillar top height)
And optionally understands:
zmin: Base level for each pillar (can be overridden by the
zminparameter)
Computed variables
normal_x,normal_y,normal_z: Face normal componentspillar_id: Sequential pillar numberface_type: Face name ("zmax", "xmin", etc.)
See also
stat_surface_3d() for smooth surface rendering, coord_3d() for 3D coordinate systems,
light() for lighting specifications, GeomPolygon3D for the default geometry.
Examples
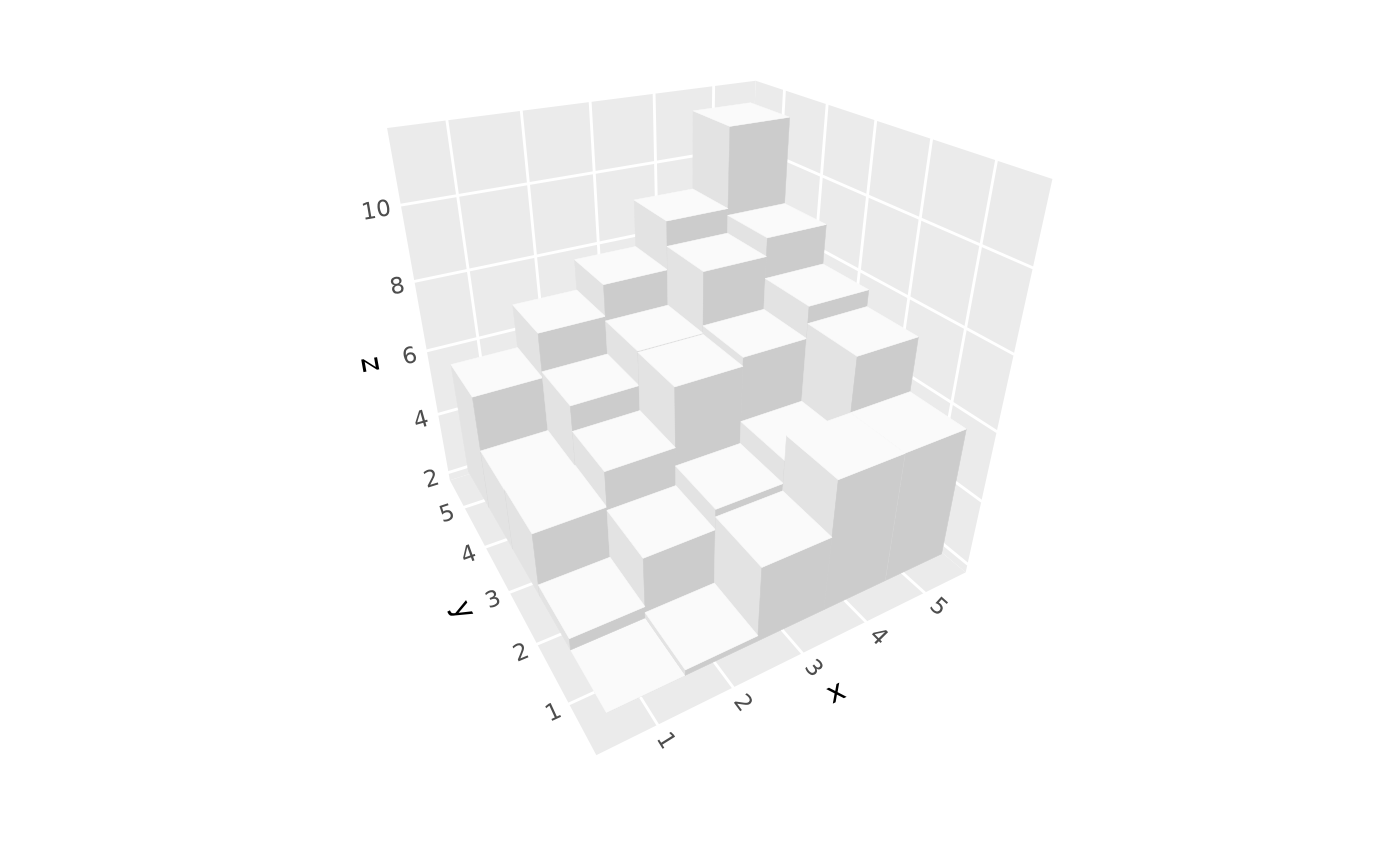
# Basic 3D bar chart from regular grid
d <- expand.grid(x = 1:5, y = 1:5)
d$z <- d$x + d$y + rnorm(25, 0, 0.5)
ggplot(d, aes(x, y, z)) +
geom_pillar_3d() +
coord_3d()
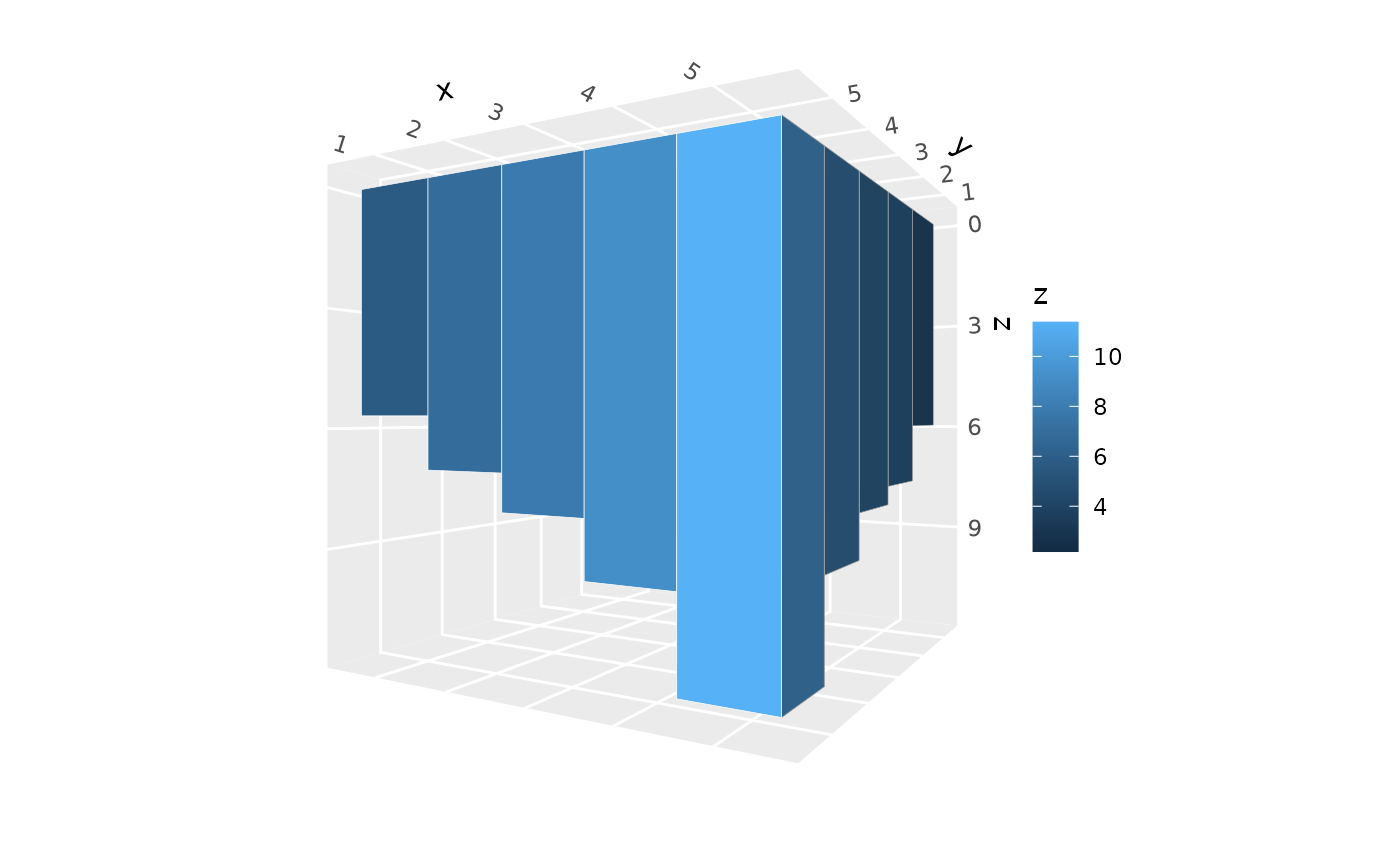
 # Set uniform base level using `zmin` parameter
ggplot(d, aes(x, y, z)) +
geom_pillar_3d(aes(fill = z), color = "white",
zmin = 0) +
coord_3d(roll = 90)
# Set uniform base level using `zmin` parameter
ggplot(d, aes(x, y, z)) +
geom_pillar_3d(aes(fill = z), color = "white",
zmin = 0) +
coord_3d(roll = 90)
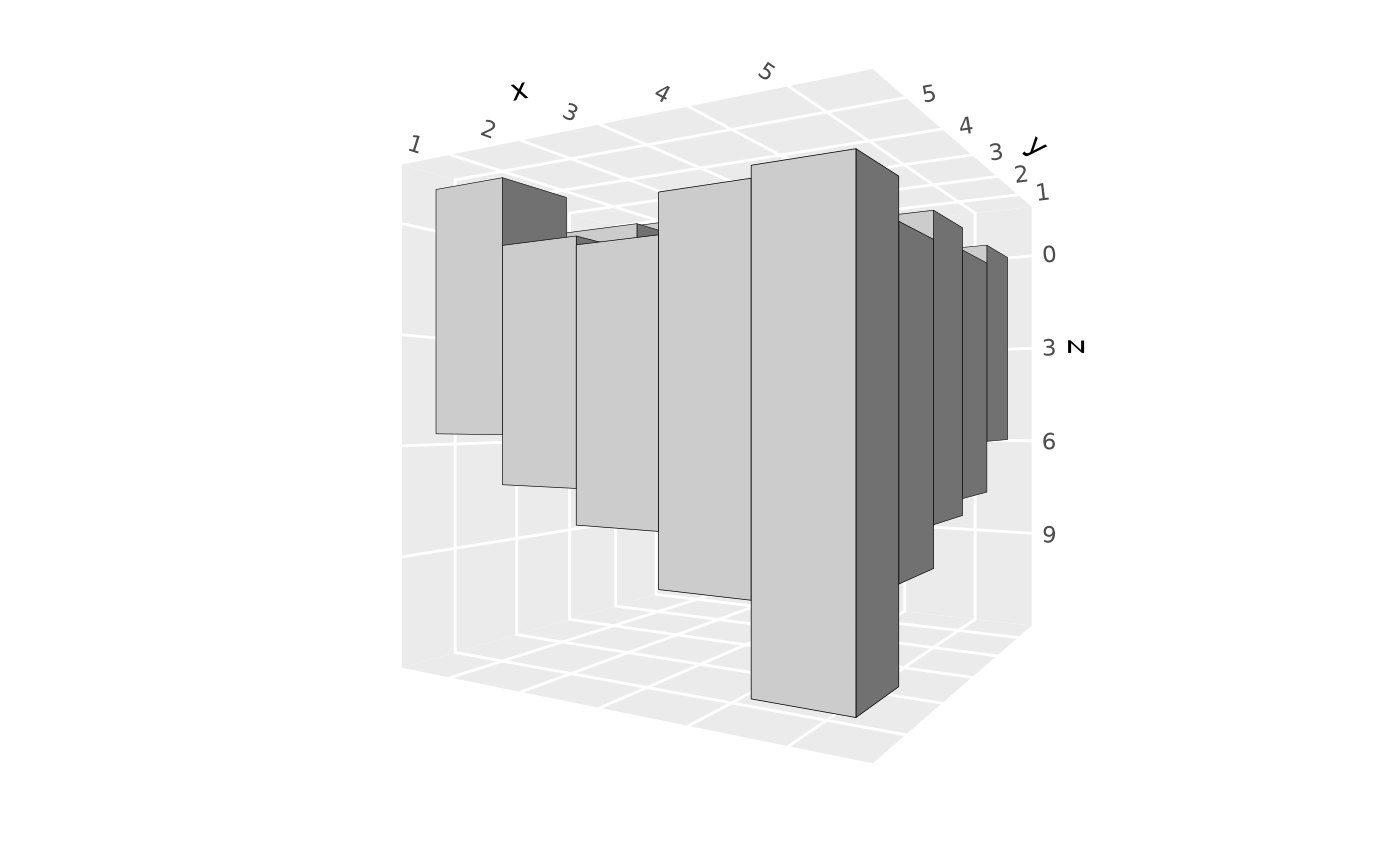
 # Set variable base levels using `zmin` aesthetic
d$base_level <- runif(nrow(d), -1, 1)
ggplot(d, aes(x, y, z = z, zmin = base_level)) +
geom_pillar_3d(color = "black") +
coord_3d(roll = 90)
# Set variable base levels using `zmin` aesthetic
d$base_level <- runif(nrow(d), -1, 1)
ggplot(d, aes(x, y, z = z, zmin = base_level)) +
geom_pillar_3d(color = "black") +
coord_3d(roll = 90)
 # Show only a subset of pillar faces
ggplot(d, aes(x, y, z)) +
geom_pillar_3d(faces = c("zmax", "ymin"),
cull_backfaces = FALSE,
fill = "steelblue", color = "black") +
coord_3d()
# Show only a subset of pillar faces
ggplot(d, aes(x, y, z)) +
geom_pillar_3d(faces = c("zmax", "ymin"),
cull_backfaces = FALSE,
fill = "steelblue", color = "black") +
coord_3d()
 # With gaps between pillars
ggplot(d, aes(x, y, z)) +
geom_pillar_3d(color = "black", width = 0.6) +
coord_3d()
# With gaps between pillars
ggplot(d, aes(x, y, z)) +
geom_pillar_3d(color = "black", width = 0.6) +
coord_3d()
