Creates 3D pillar visualizations from grid data (regular or sparse). Each data point becomes a rectangular 3D column extending from a base level to the data value. Perfect for 3D bar charts, architectural visualization, and terrain layers. Works with both complete regular grids and sparse point data.
Usage
stat_pillar_3d(
  mapping = NULL,
  data = NULL,
  geom = GeomPolygon3D,
  position = "identity",
  width = 1,
  faces = "all",
  light = lighting(),
  zmin = NULL,
  na.rm = FALSE,
  show.legend = NA,
  inherit.aes = TRUE,
  ...
)
Arguments
- mapping
Set of aesthetic mappings created by
aes().- data
The data to be displayed in this layer.
- geom
The geometric object to use display the data. Defaults to GeomPolygon3D for proper 3D depth sorting.
- position
Position adjustment, defaults to "identity".
- width
Numeric value controlling pillar width as a fraction of grid spacing. Default is 1.0 (pillars touch each other). Use 0.8 for small gaps, 1.2 for overlap. Grid spacing is determined automatically using
resolution().- faces
Character vector specifying which faces to render. Options:
"all"(default): Render all 6 faces"none": Render no facesVector of face names:
c("zmax", "xmin", "ymax"), etc.
Valid face names: "xmin", "xmax", "ymin", "ymax", "zmin", "zmax".
- light
A lighting specification object created by
lighting()- zmin
Base level for all pillars. When provided as a parameter, overrides any
zminaesthetic mapping. IfNULL(default), uses thezminaesthetic if mapped, otherwise defaults to the minimumzvalue in the data.- na.rm
If
FALSE, missing values are removed with a warning.- show.legend
Logical indicating whether this layer should be included in legends.
- inherit.aes
If
FALSE, overrides the default aesthetics.- ...
Other arguments passed on to
layer().
Aesthetics
stat_pillar_3d() requires the following aesthetics:
x: X coordinate (grid position)
y: Y coordinate (grid position)
z: Z coordinate (pillar top height)
And optionally understands:
zmin: Base level for each pillar (can be overridden by the
zminparameter)
Computed variables
light: Computed lighting value (numeric for most methods, hex color fornormal_rgb)normal_x,normal_y,normal_z: Face normal componentsgroup: Hierarchical group identifier with format "pillarX__face_type" for proper depth sortingpillar_id: Sequential pillar numberface_type: Face name ("zmax", "xmin", etc.)
See also
stat_surface_3d() for smooth surface rendering, coord_3d() for 3D coordinate systems,
lighting() for lighting specifications, GeomPolygon3D for the default geometry.
Examples
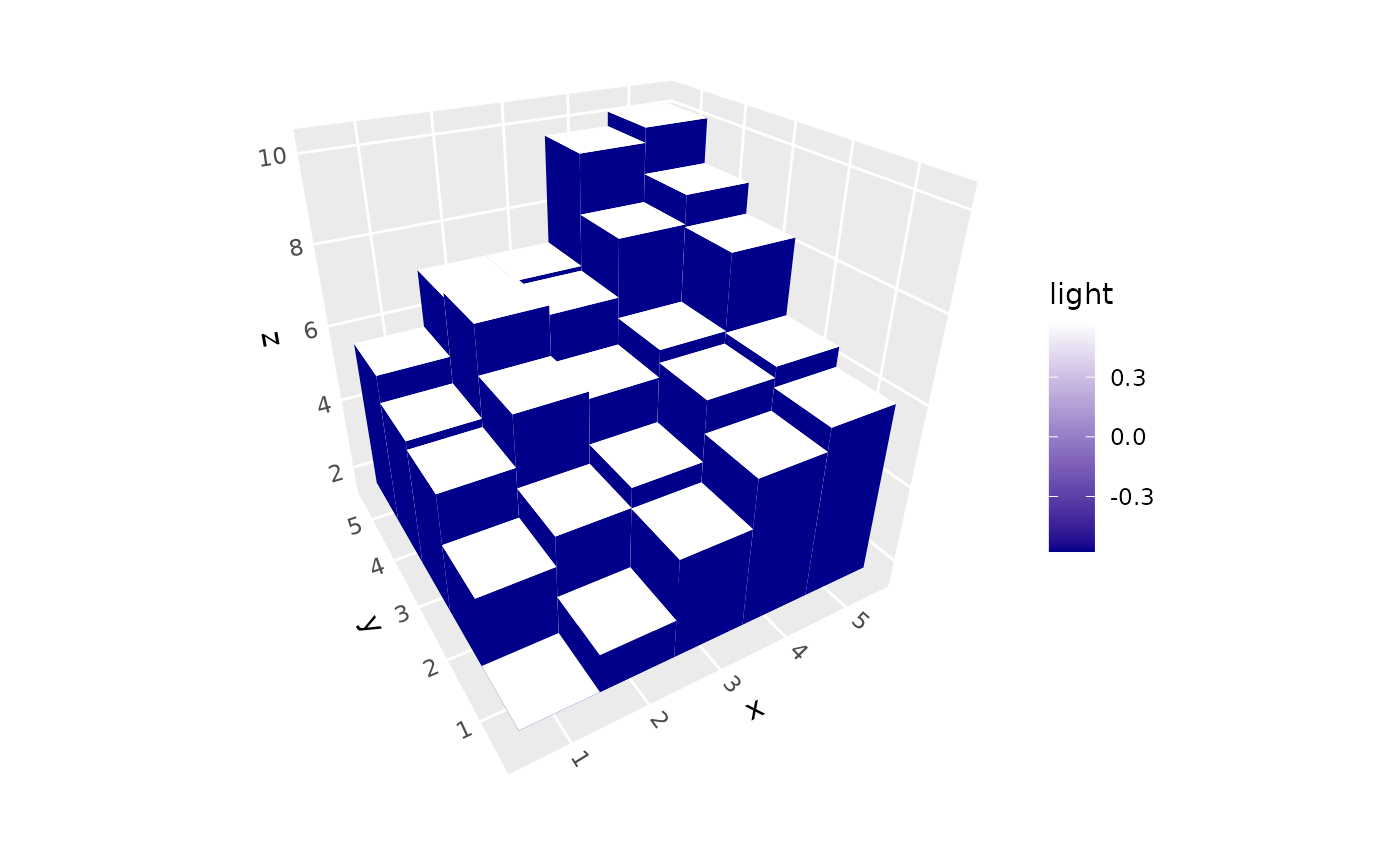
# Basic 3D bar chart from regular grid
d <- expand.grid(x = 1:5, y = 1:5)
d$z <- d$x + d$y + rnorm(25, 0, 0.5)
ggplot(d, aes(x, y, z)) +
stat_pillar_3d(aes(fill = after_stat(light))) +
scale_fill_gradient(low = "darkblue", high = "white") +
coord_3d()
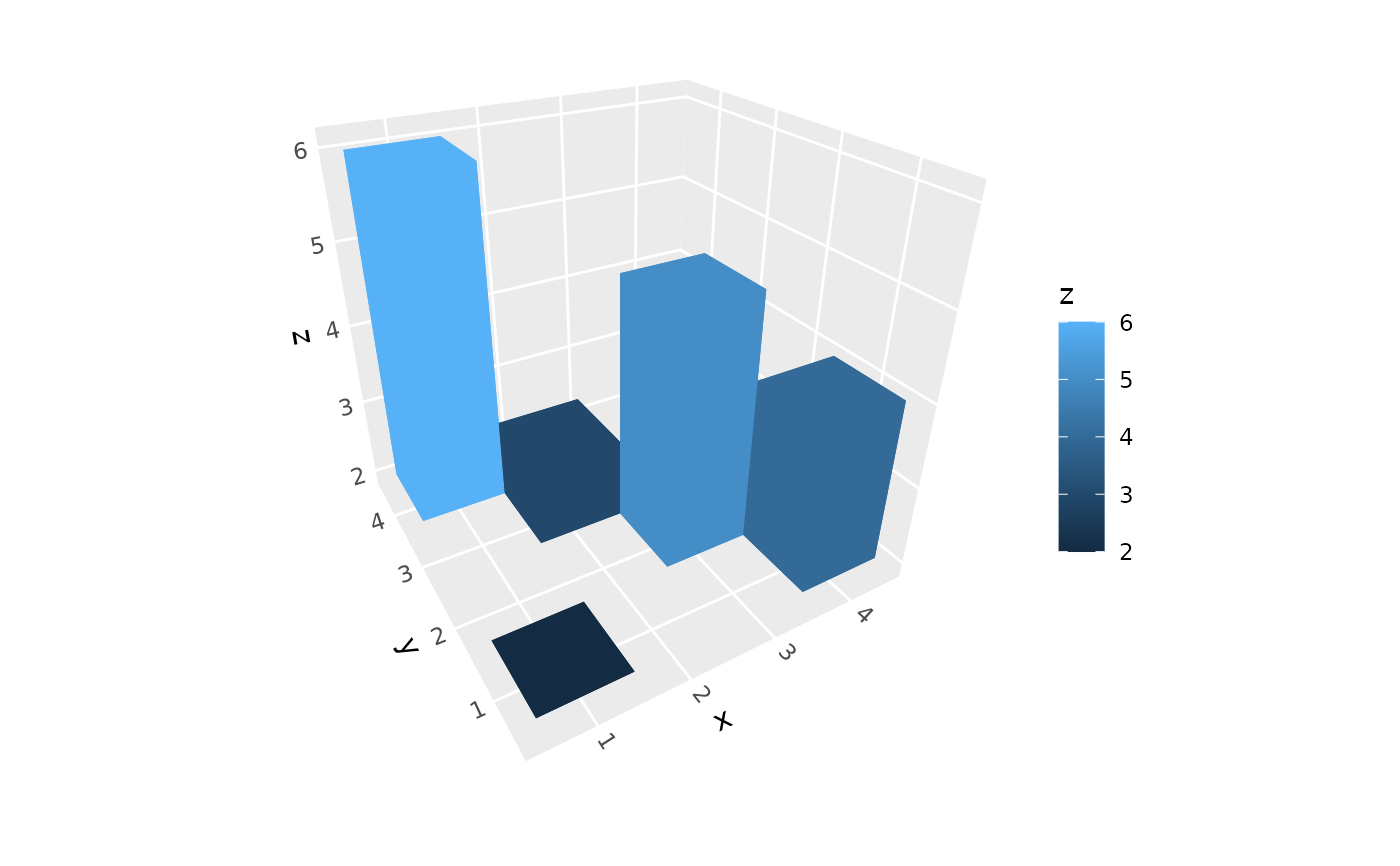
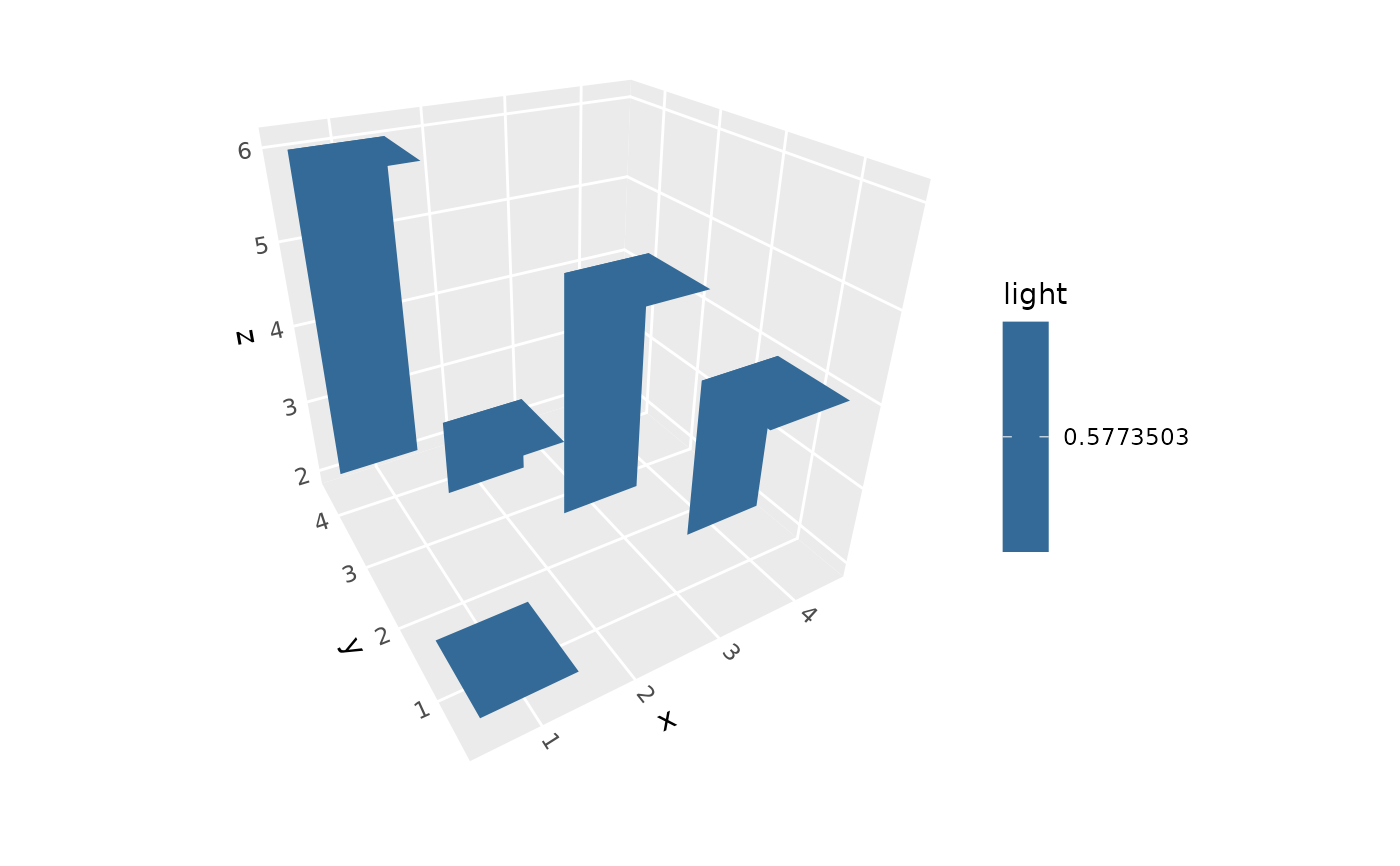
 # Sparse data (only some points)
sparse_data <- data.frame(
x = c(1, 3, 2, 4, 1),
y = c(1, 2, 3, 1, 4),
z = c(2, 5, 3, 4, 6)
)
ggplot(sparse_data, aes(x, y, z)) +
stat_pillar_3d(aes(fill = z)) +
coord_3d()
# Sparse data (only some points)
sparse_data <- data.frame(
x = c(1, 3, 2, 4, 1),
y = c(1, 2, 3, 1, 4),
z = c(2, 5, 3, 4, 6)
)
ggplot(sparse_data, aes(x, y, z)) +
stat_pillar_3d(aes(fill = z)) +
coord_3d()
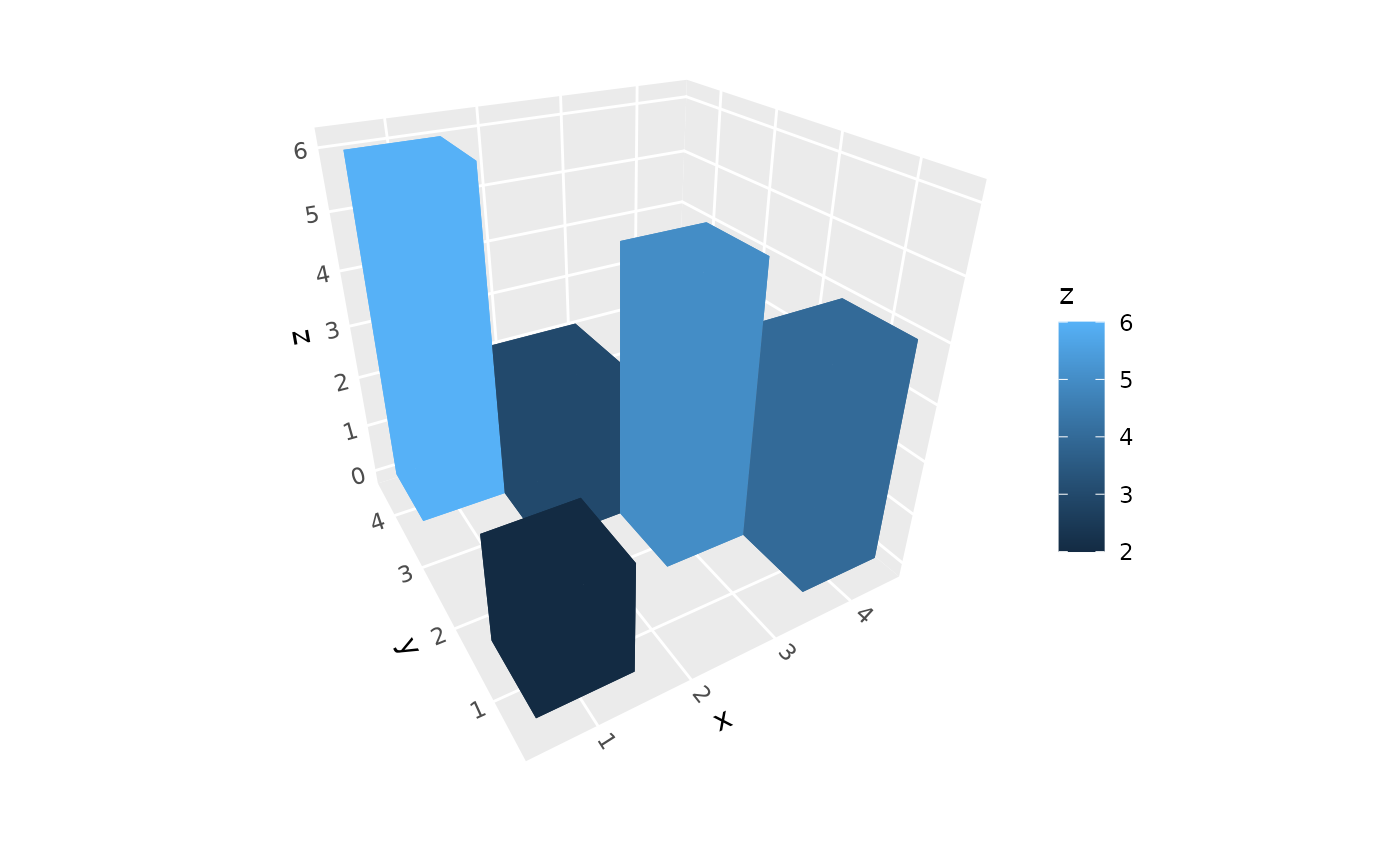
 # Set base level for all pillars using parameter
ggplot(sparse_data, aes(x, y, z)) +
stat_pillar_3d(aes(fill = z), zmin = 0) +
coord_3d()
# Set base level for all pillars using parameter
ggplot(sparse_data, aes(x, y, z)) +
stat_pillar_3d(aes(fill = z), zmin = 0) +
coord_3d()
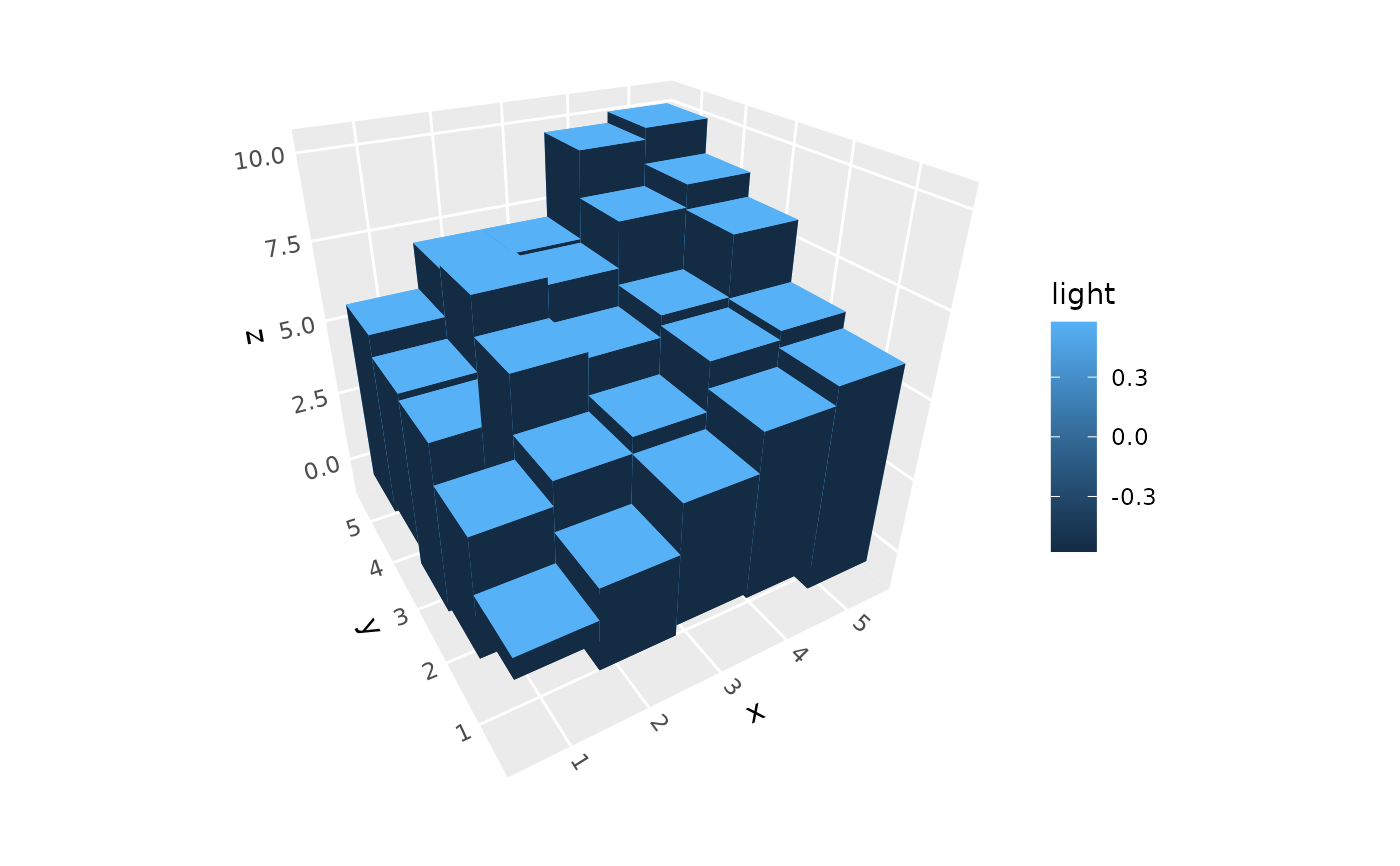
 # Variable base levels using aesthetic
d$base_level <- runif(nrow(d), -1, 1)
ggplot(d, aes(x, y, z = z, zmin = base_level)) +
stat_pillar_3d(aes(fill = after_stat(light))) +
coord_3d()
# Variable base levels using aesthetic
d$base_level <- runif(nrow(d), -1, 1)
ggplot(d, aes(x, y, z = z, zmin = base_level)) +
stat_pillar_3d(aes(fill = after_stat(light))) +
coord_3d()
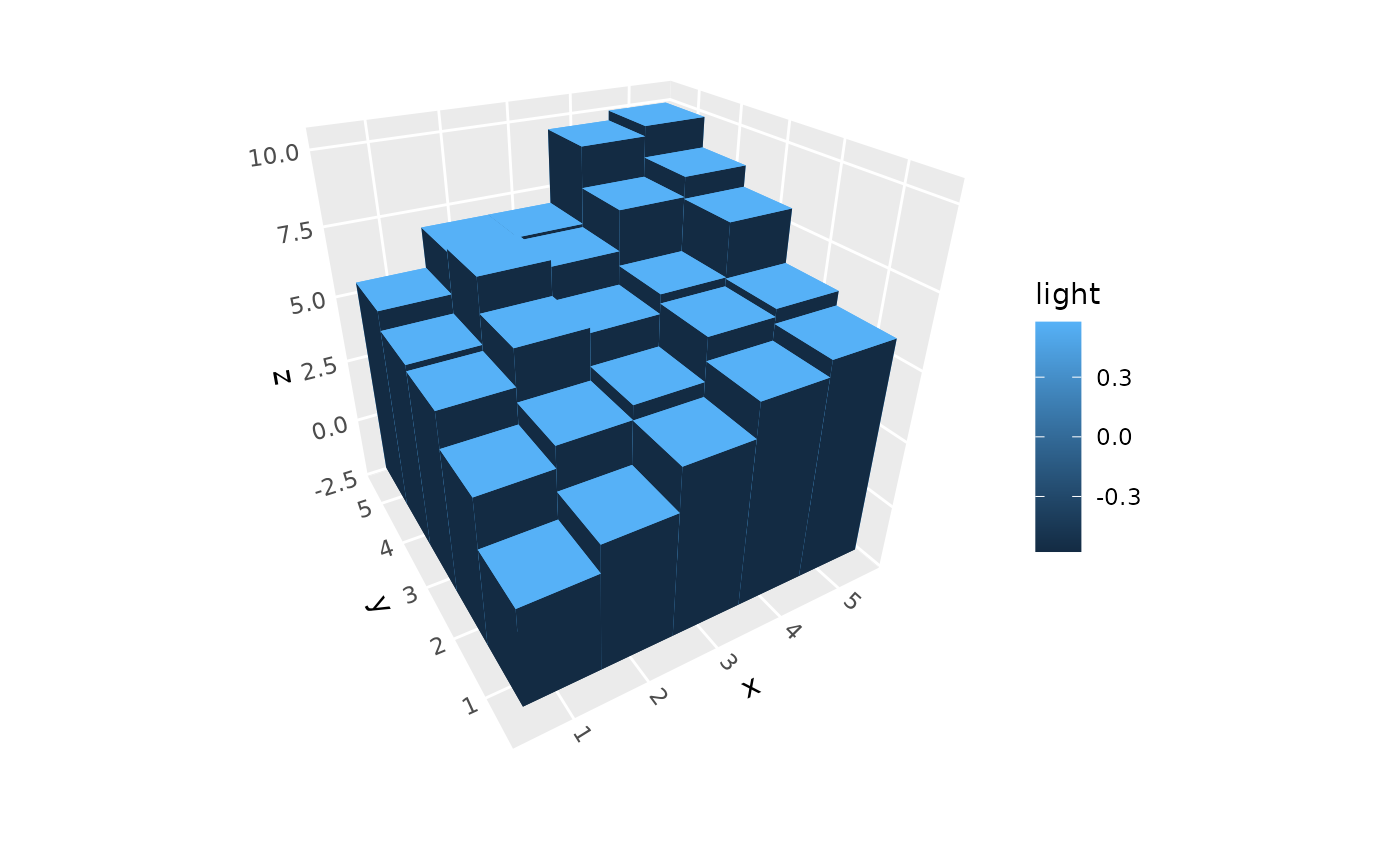
 # Parameter overrides aesthetic
ggplot(d, aes(x, y, z = z, zmin = base_level)) +
stat_pillar_3d(aes(fill = after_stat(light)), zmin = -2) + # All pillars use zmin = -2
coord_3d()
# Parameter overrides aesthetic
ggplot(d, aes(x, y, z = z, zmin = base_level)) +
stat_pillar_3d(aes(fill = after_stat(light)), zmin = -2) + # All pillars use zmin = -2
coord_3d()
 # Show only top and front faces for performance
ggplot(sparse_data, aes(x, y, z)) +
stat_pillar_3d(aes(fill = after_stat(light)),
faces = c("zmax", "ymax")) +
coord_3d()
# Show only top and front faces for performance
ggplot(sparse_data, aes(x, y, z)) +
stat_pillar_3d(aes(fill = after_stat(light)),
faces = c("zmax", "ymax")) +
coord_3d()
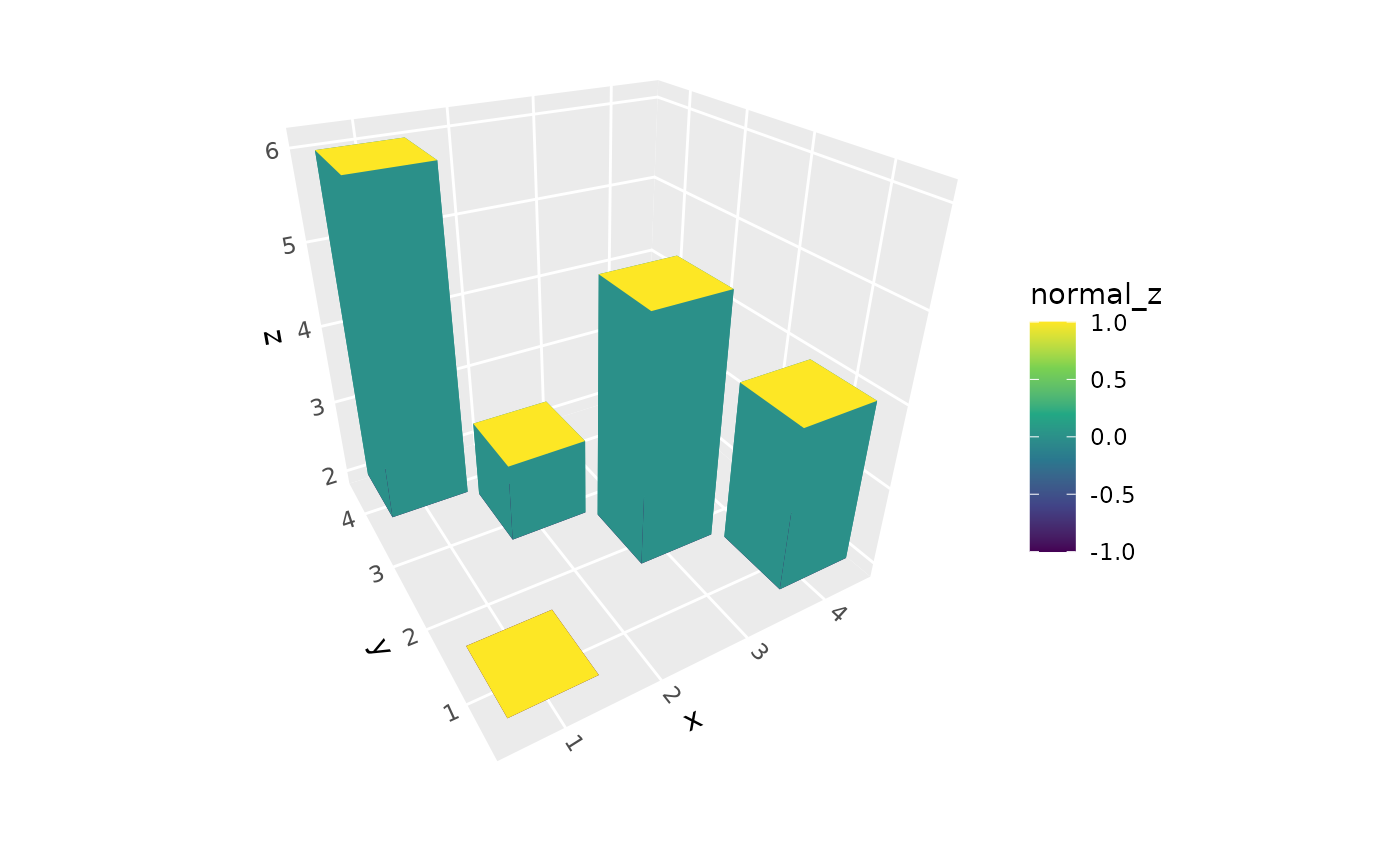
 # Architectural visualization with gaps between pillars
ggplot(sparse_data, aes(x, y, z)) +
stat_pillar_3d(aes(fill = after_stat(normal_z)),
width = 0.9, light = lighting("direct")) +
scale_fill_viridis_c() +
coord_3d()
# Architectural visualization with gaps between pillars
ggplot(sparse_data, aes(x, y, z)) +
stat_pillar_3d(aes(fill = after_stat(normal_z)),
width = 0.9, light = lighting("direct")) +
scale_fill_viridis_c() +
coord_3d()