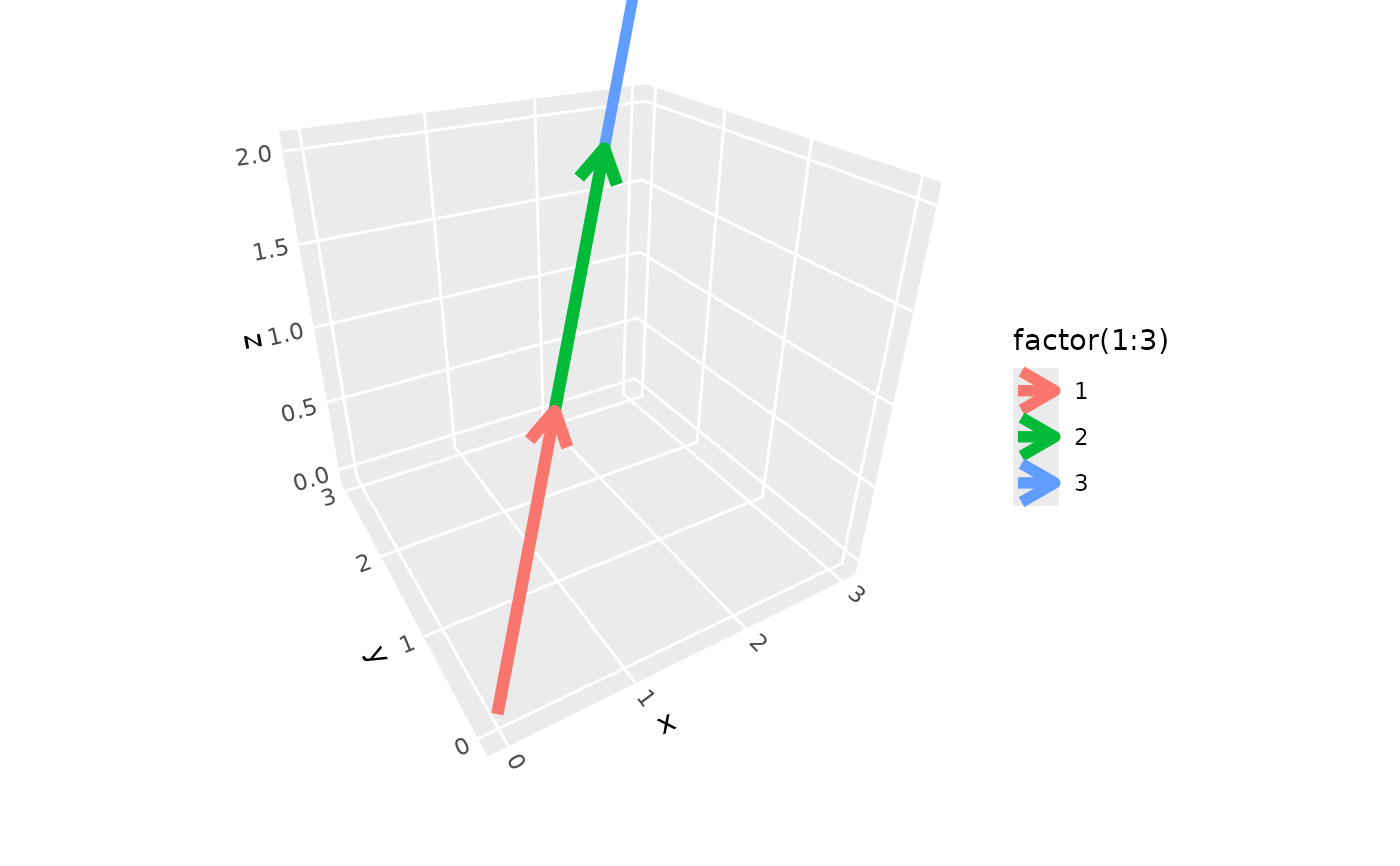
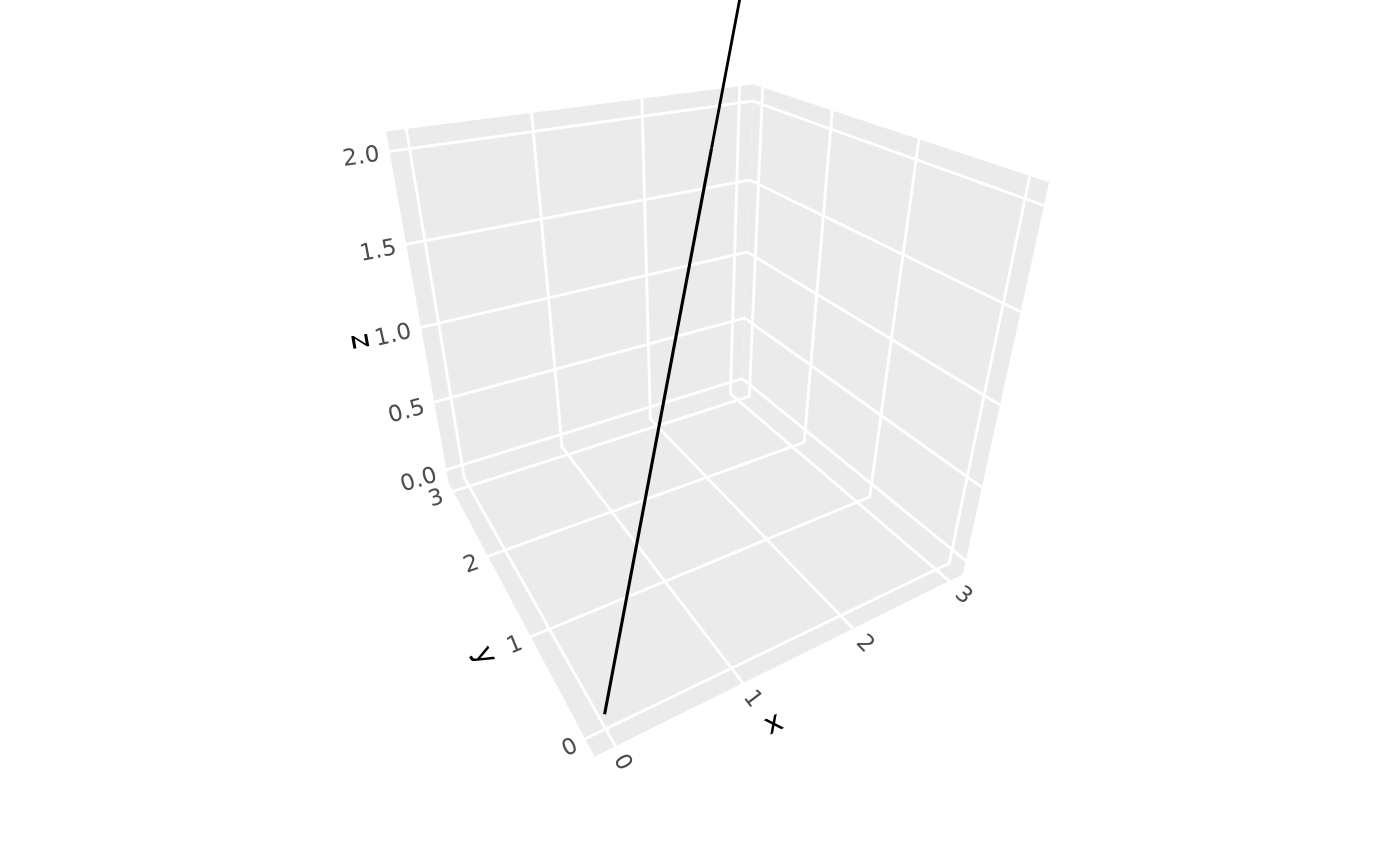
geom_segment_3d() and stat_segment_3d() draw line segments in 3D space
with automatic depth-based linewidth scaling and proper depth sorting.
Each segment is defined by start coordinates (x, y, z) and end
coordinates (xend, yend, zend).
Usage
geom_segment_3d(
  mapping = NULL,
  data = NULL,
  stat = StatSegment3D,
  position = "identity",
  ...,
  sort_method = "painter",
  scale_depth = TRUE,
  arrow = NULL,
  lineend = "butt",
  na.rm = FALSE,
  show.legend = NA,
  inherit.aes = TRUE
)

stat_segment_3d(
  mapping = NULL,
  data = NULL,
  geom = GeomSegment3D,
  position = "identity",
  ...,
  sort_method = "painter",
  scale_depth = TRUE,
  arrow = NULL,
  lineend = "butt",
  na.rm = FALSE,
  show.legend = NA,
  inherit.aes = TRUE
)
Arguments
- mapping
Set of aesthetic mappings created by
aes(). Requires x, y, z for start coordinates and xend, yend, zend for end coordinates.- data
The data to be displayed in this layer.
- stat
The statistical transformation to use on the data. Defaults to
"segment_3d".- position
Position adjustment, defaults to "identity".
- ...
Other arguments passed on to
ggplot2::layer().- sort_method
Depth sorting algorithm. See sorting_methods for details.
- scale_depth
Logical indicating whether to apply depth-based scaling to linewidth. When
TRUE(default), segments closer to the viewer appear thicker, and segments farther away appear thinner.- arrow
Specification for arrow heads, created by
arrow().- lineend
Line end style, one of "round", "butt", "square".
- na.rm
If
FALSE, missing values are removed with a warning.- show.legend
Logical indicating whether this layer should be included in legends.
- inherit.aes
If
FALSE, overrides the default aesthetics.- geom
The geometric object used to display the data. Defaults to
"segment_3d".
Aesthetics
geom_segment_3d() understands the following aesthetics:
x, y, z: Start coordinates (required)
xend, yend, zend: End coordinates (required)
colour: Line colorlinewidth: Line width (gets depth-scaled whenscale_depth = TRUE)linetype: Line typealpha: Transparency
See also
geom_path_3d() for connected paths.
Examples
# Basic 3D segments
ggplot(sphere_points,
      aes(x, y, z, xend = 0, yend = 0, zend = 0)) +
  geom_segment_3d() +
  coord_3d()


# 3D vector field
data <- expand.grid(x = -1:2, y = -1:2, z = -1:2)
data2 <- data + seq(-.5, .5, length.out = length(as.matrix(data)))
data <- cbind(data, setNames(data2, c("x2", "y2", "z2")))
ggplot(data, aes(x, y, z,
      xend = x2, yend = y2, zend = z2, color = x)) +
  geom_segment_3d(arrow = arrow(length = unit(0.1, "inches"),
                  type = "closed", angle = 15),
                  linewidth = .5) +
  coord_3d()
# 3D vector field
data <- expand.grid(x = -1:2, y = -1:2, z = -1:2)
data2 <- data + seq(-.5, .5, length.out = length(as.matrix(data)))
data <- cbind(data, setNames(data2, c("x2", "y2", "z2")))
ggplot(data, aes(x, y, z,
xend = x2, yend = y2, zend = z2, color = x)) +
geom_segment_3d(arrow = arrow(length = unit(0.1, "inches"),
type = "closed", angle = 15),
linewidth = .5) +
coord_3d()