Connects observations in 3D space in the order they appear in the data. It converts path data into individual segments for proper depth sorting while maintaining the appearance of connected paths. Each path is divided into segments that can be depth-sorted independently.
Usage
geom_path_3d(
  mapping = NULL,
  data = NULL,
  stat = StatPath3D,
  position = "identity",
  ...,
  sort_method = "painter",
  scale_depth = TRUE,
  arrow = NULL,
  lineend = "butt",
  na.rm = FALSE,
  show.legend = NA,
  inherit.aes = TRUE
)

stat_path_3d(
  mapping = NULL,
  data = NULL,
  geom = GeomSegment3D,
  position = "identity",
  ...,
  sort_method = "painter",
  scale_depth = TRUE,
  arrow = NULL,
  lineend = "butt",
  na.rm = FALSE,
  show.legend = NA,
  inherit.aes = TRUE
)
Arguments
- mapping
Set of aesthetic mappings created by
aes(). Requires x, y, z coordinates. Grouping aesthetics determine separate paths.- data
The data to be displayed in this layer.
- stat
The statistical transformation to use on the data. Defaults to
"path_3d".- position
Position adjustment, defaults to "identity".
- ...
Other arguments passed on to
ggplot2::layer().- sort_method
Depth sorting algorithm. See sorting_methods for details.
- scale_depth
Logical indicating whether to apply depth-based scaling to linewidth. When
TRUE(default), path segments closer to the viewer appear thicker, and segments farther away appear thinner.- arrow
Specification for arrow heads, created by
arrow().- lineend
Line end style, one of "round", "butt", "square".
- na.rm
If
FALSE, missing values are removed with a warning.- show.legend
Logical indicating whether this layer should be included in legends.
- inherit.aes
If
FALSE, overrides the default aesthetics.- geom
The geometric object used to display the data. Defaults to
"segment_3d".
Aesthetics
geom_path_3d() understands the following aesthetics:
x, y, z: Coordinates (required)
group: Grouping variable to create separate pathscolour: Line colorlinewidth: Line width (gets depth-scaled whenscale_depth = TRUE)linetype: Line typealpha: Transparency
Computed variables for StatSegment3D
x,y,z: Start coordinates of each segmentxend,yend,zend: End coordinates of each segmentgroup: Hierarchical group identifier preserving original grouping
Grouping
Multiple paths are created based on grouping aesthetics (group, colour, etc.). Each group forms a separate path, and segments from different paths can be interleaved during depth sorting for proper 3D rendering.
See also
geom_segment_3d() for individual segments.
Examples
library(ggplot2)
x <- seq(0, 20*pi, pi/16)
spiral <- data.frame(
x = x,
y = sin(x),
z = cos(x))
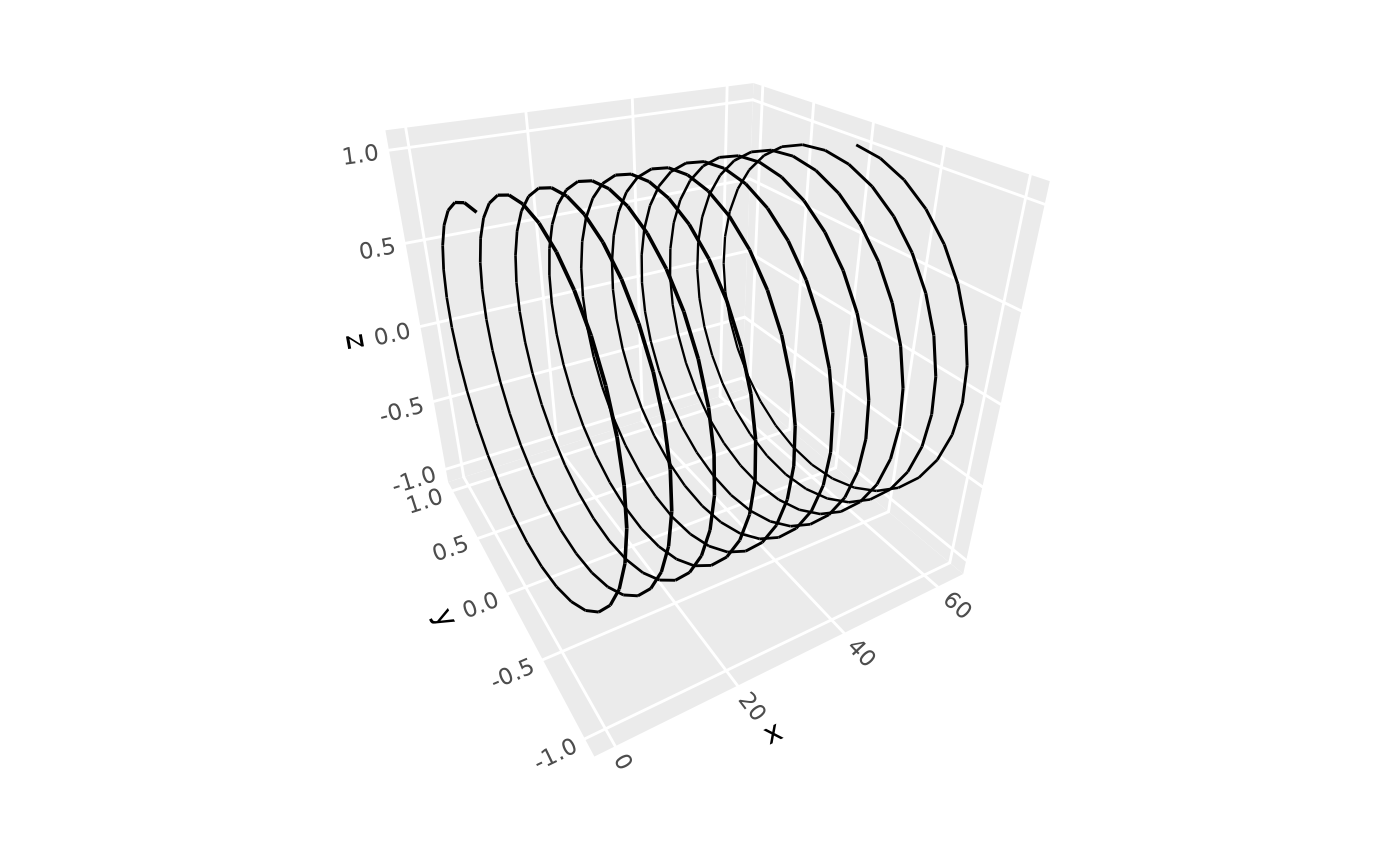
# Basic path
ggplot(spiral, aes(x, y, z)) +
geom_path_3d() +
coord_3d()
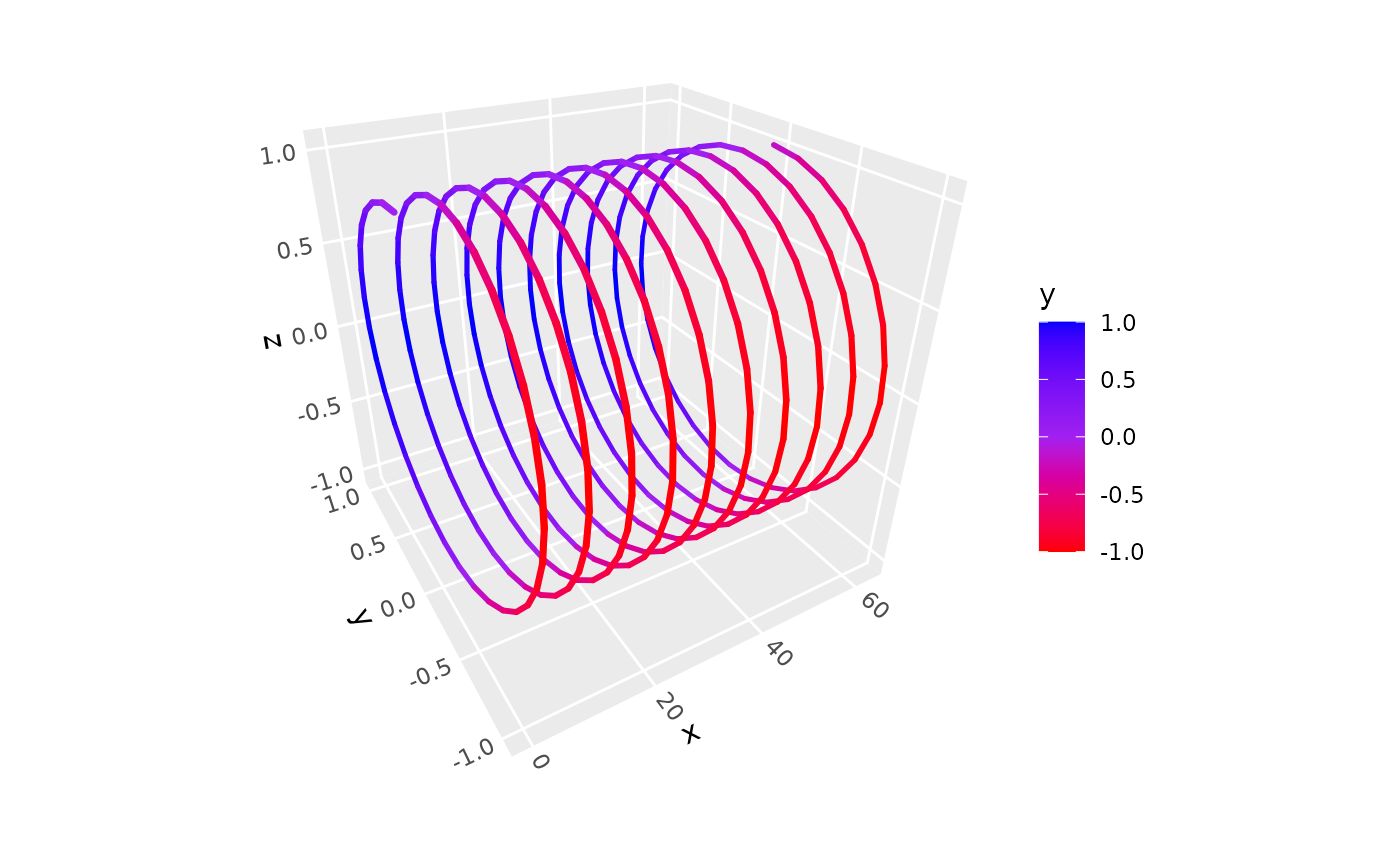
 # With aesthetic coloring
ggplot(spiral, aes(x, y, z, color = y)) +
geom_path_3d(linewidth = 1, lineend = "round") +
coord_3d() +
scale_color_gradientn(colors = c("red", "purple", "blue"))
# With aesthetic coloring
ggplot(spiral, aes(x, y, z, color = y)) +
geom_path_3d(linewidth = 1, lineend = "round") +
coord_3d() +
scale_color_gradientn(colors = c("red", "purple", "blue"))
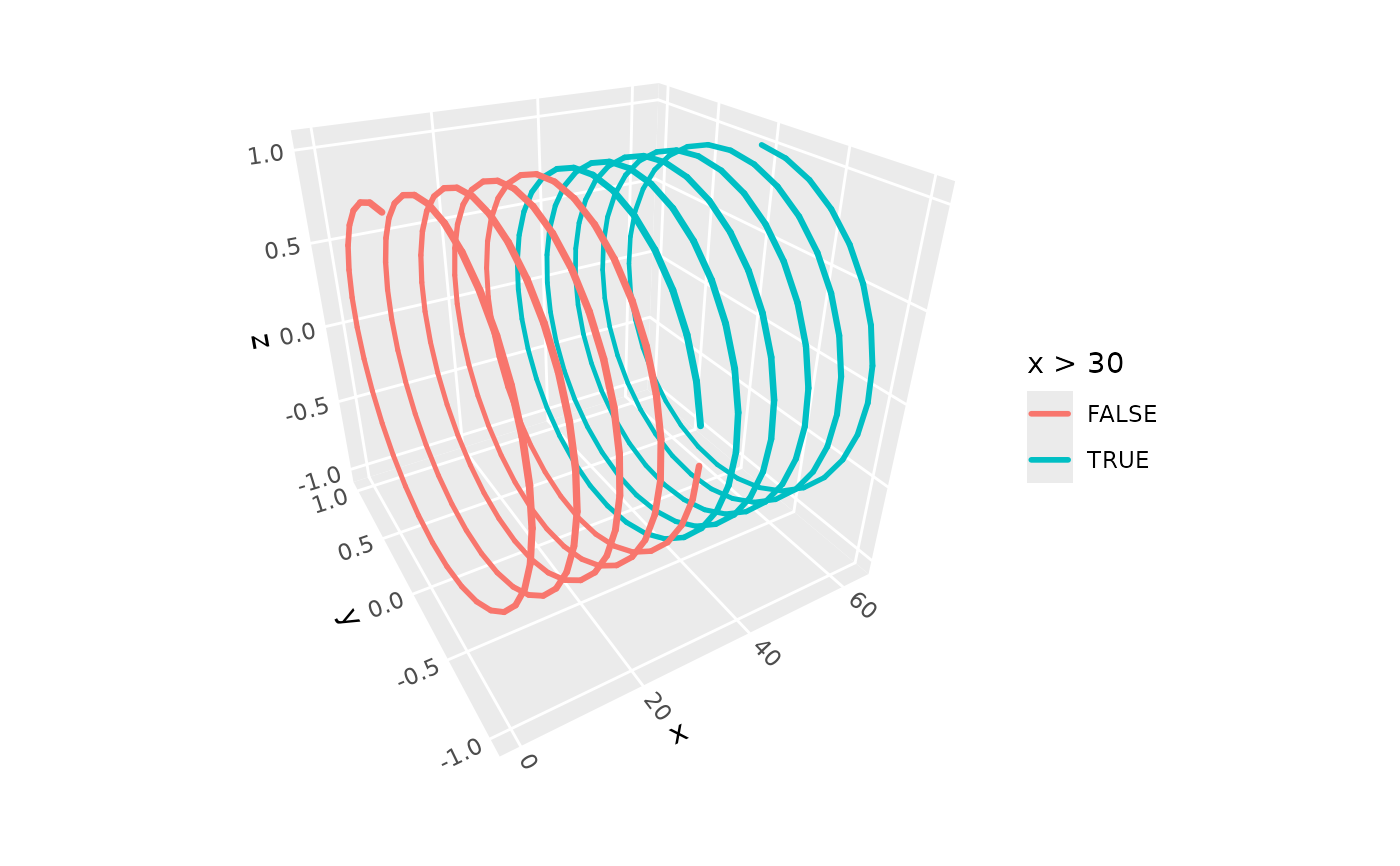
 # With grouping
ggplot(spiral, aes(x, y, z, color = x > 30)) +
geom_path_3d(linewidth = 1, lineend = "round") +
coord_3d()
# With grouping
ggplot(spiral, aes(x, y, z, color = x > 30)) +
geom_path_3d(linewidth = 1, lineend = "round") +
coord_3d()