This is a shorthand for scale_z_continuous(limits = c(min, max)).
It's a convenient way to set the z-axis limits without specifying other
scale parameters.
Arguments
- min, max
The minimum and maximum values for the z-axis.
- ...
Additional arguments passed to
scale_z_continuous().
See also
scale_z_continuous for more control over z-axis scaling,
xlim, ylim for x and y axis limits
Other 3D scale functions:
scale_z_continuous(),
scale_z_discrete()
Examples
library(ggplot2)
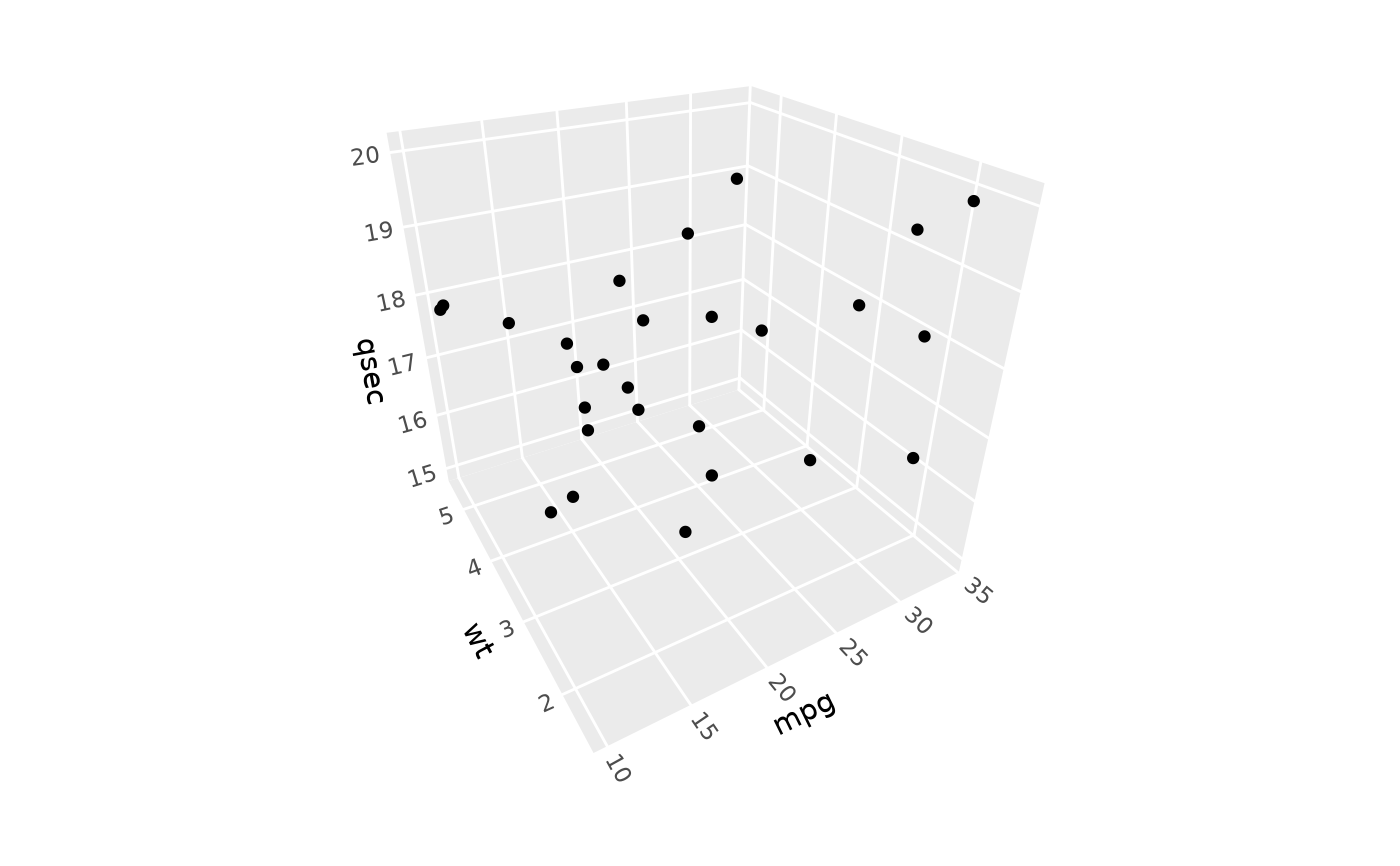
# Set z-axis limits
ggplot(mtcars, aes(mpg, wt, z = qsec)) +
geom_point() +
zlim(15, 20) +
coord_3d()
 # Equivalent to:
ggplot(mtcars, aes(mpg, wt, z = qsec)) +
geom_point() +
scale_z_continuous(limits = c(15, 20)) +
coord_3d()
# Equivalent to:
ggplot(mtcars, aes(mpg, wt, z = qsec)) +
geom_point() +
scale_z_continuous(limits = c(15, 20)) +
coord_3d()