Growing an evolutionary tree
[VISUALIZATION] Animating phylogenies in R.

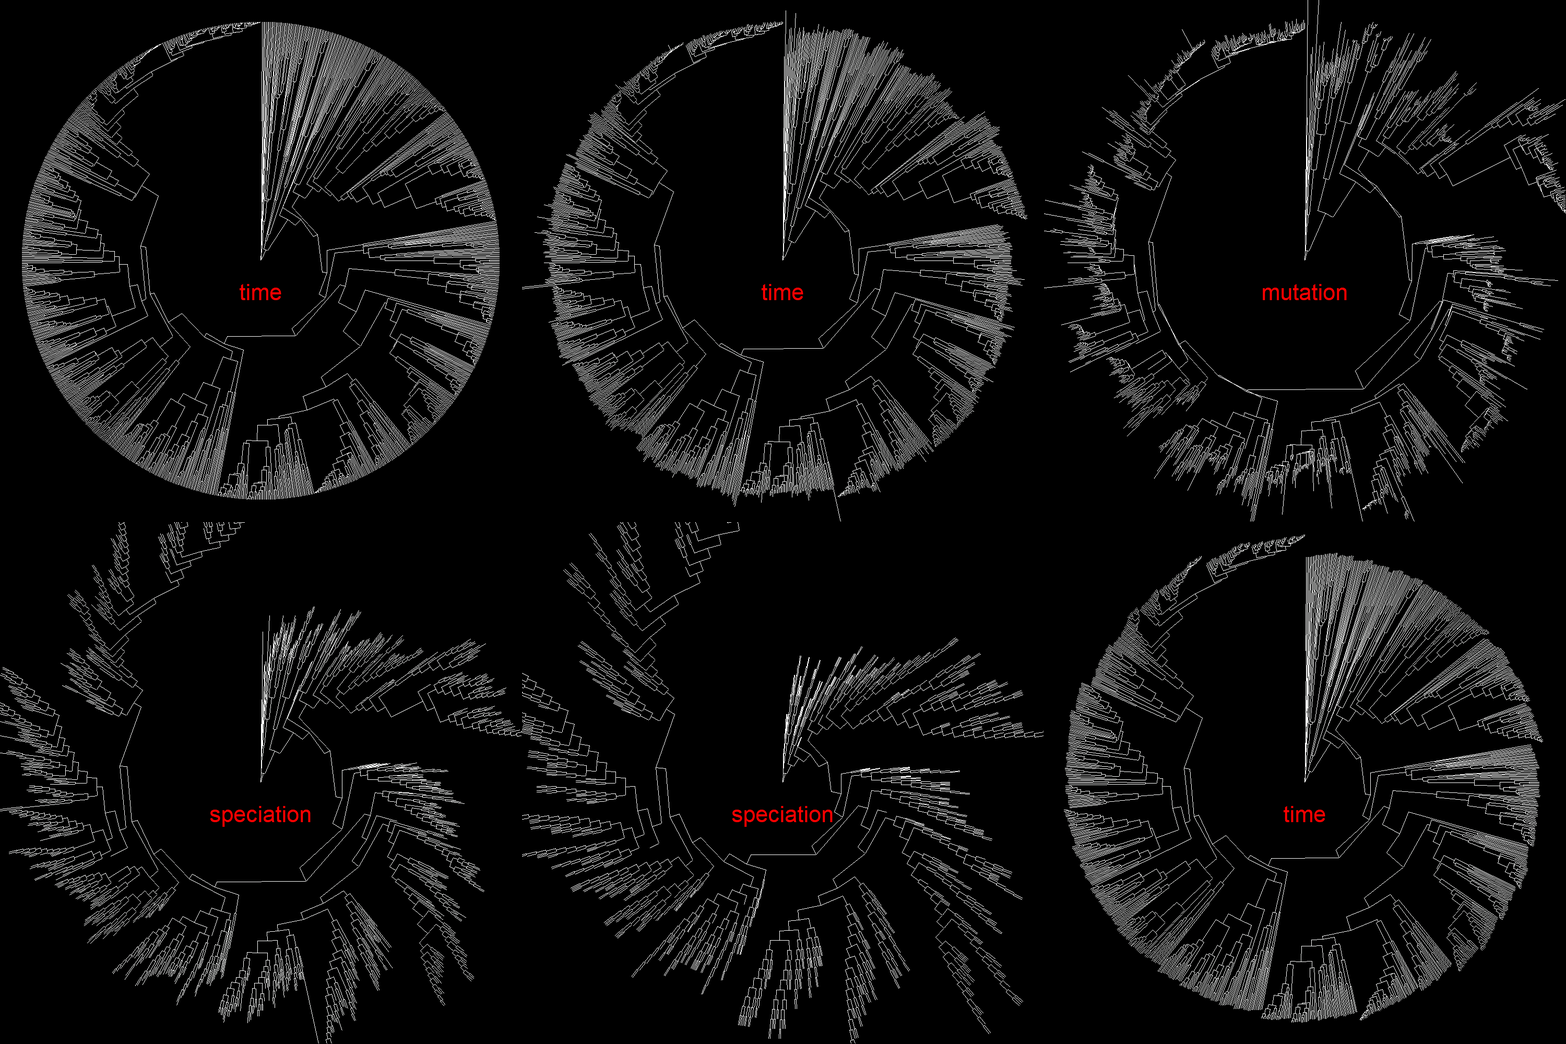
I had fun working on some visuals this week for my talk at the Half-Earth Day symposium on biodiversity conservation. The talk was focused on using evolutionary history to help identify conservation priorities for California plants. I used gganimate to create these two animations of the evolutionary tree of California plants. Above we see the growth of the tree over the past couple hundred million years, with color representing time, and branch length representing genetic mutations.
In the animation below, the tree morphs among three different representations of evolutionary branch length. These branch length metrics represent alternative definitions of biodiversity, each with a different connection to conservation goals. Major differences among the three macroevolutionary metrics in which lineages are most evolutionarily distinctive!
