ggcube
[R PACKAGE] A ggplot2 extension for 3D visualization
Overview
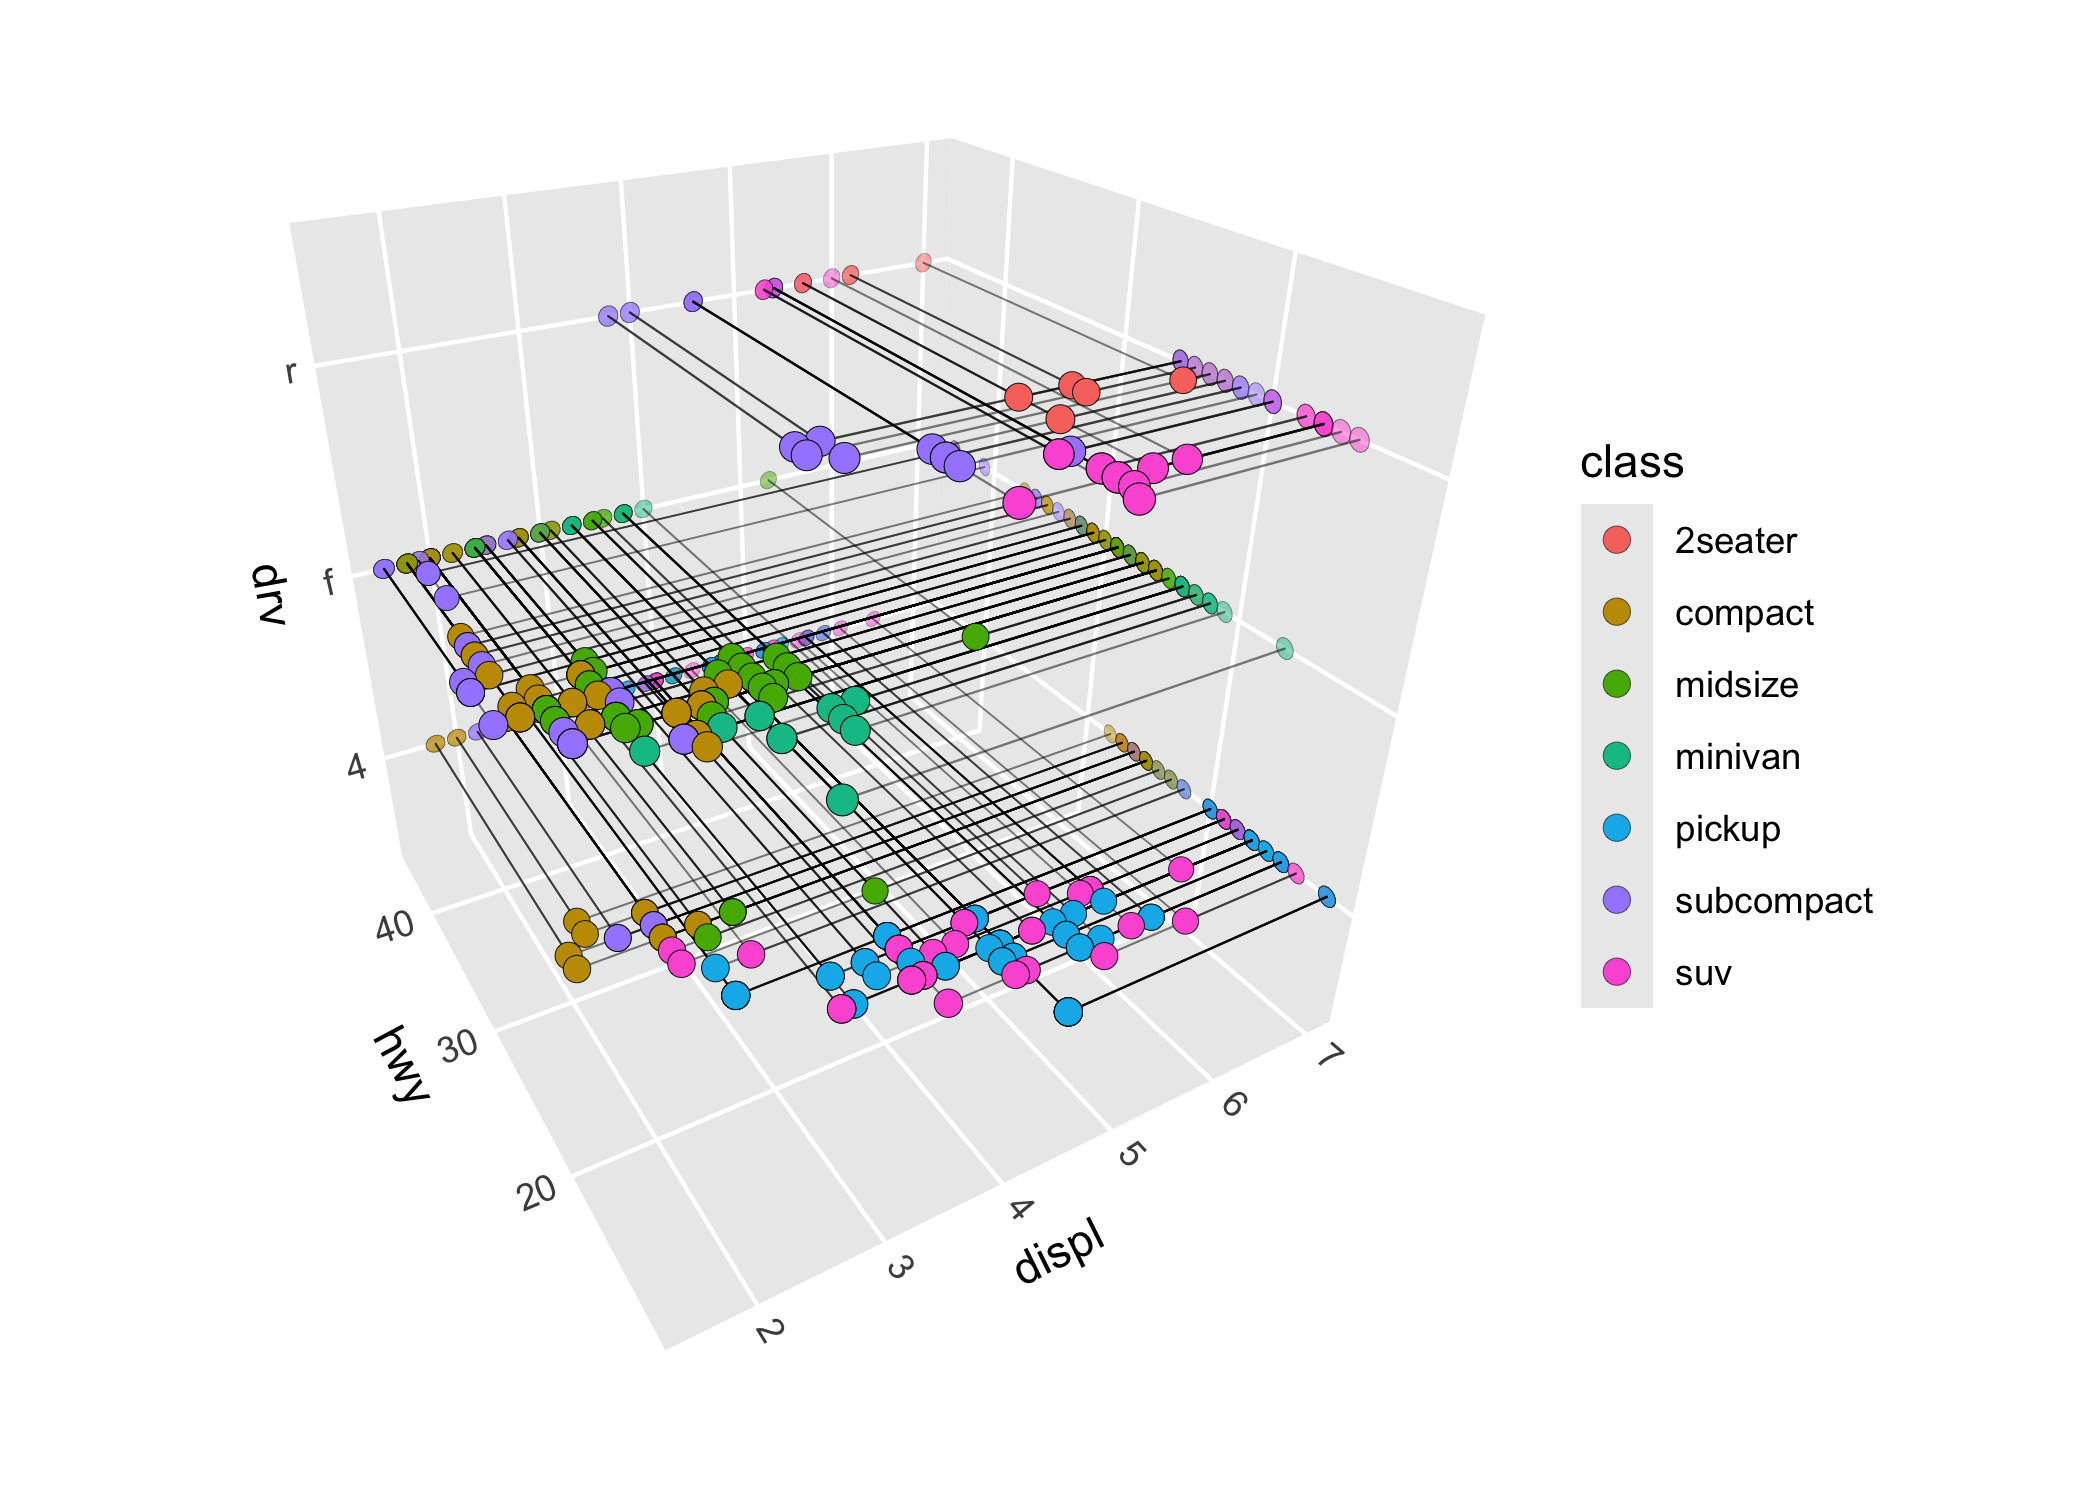
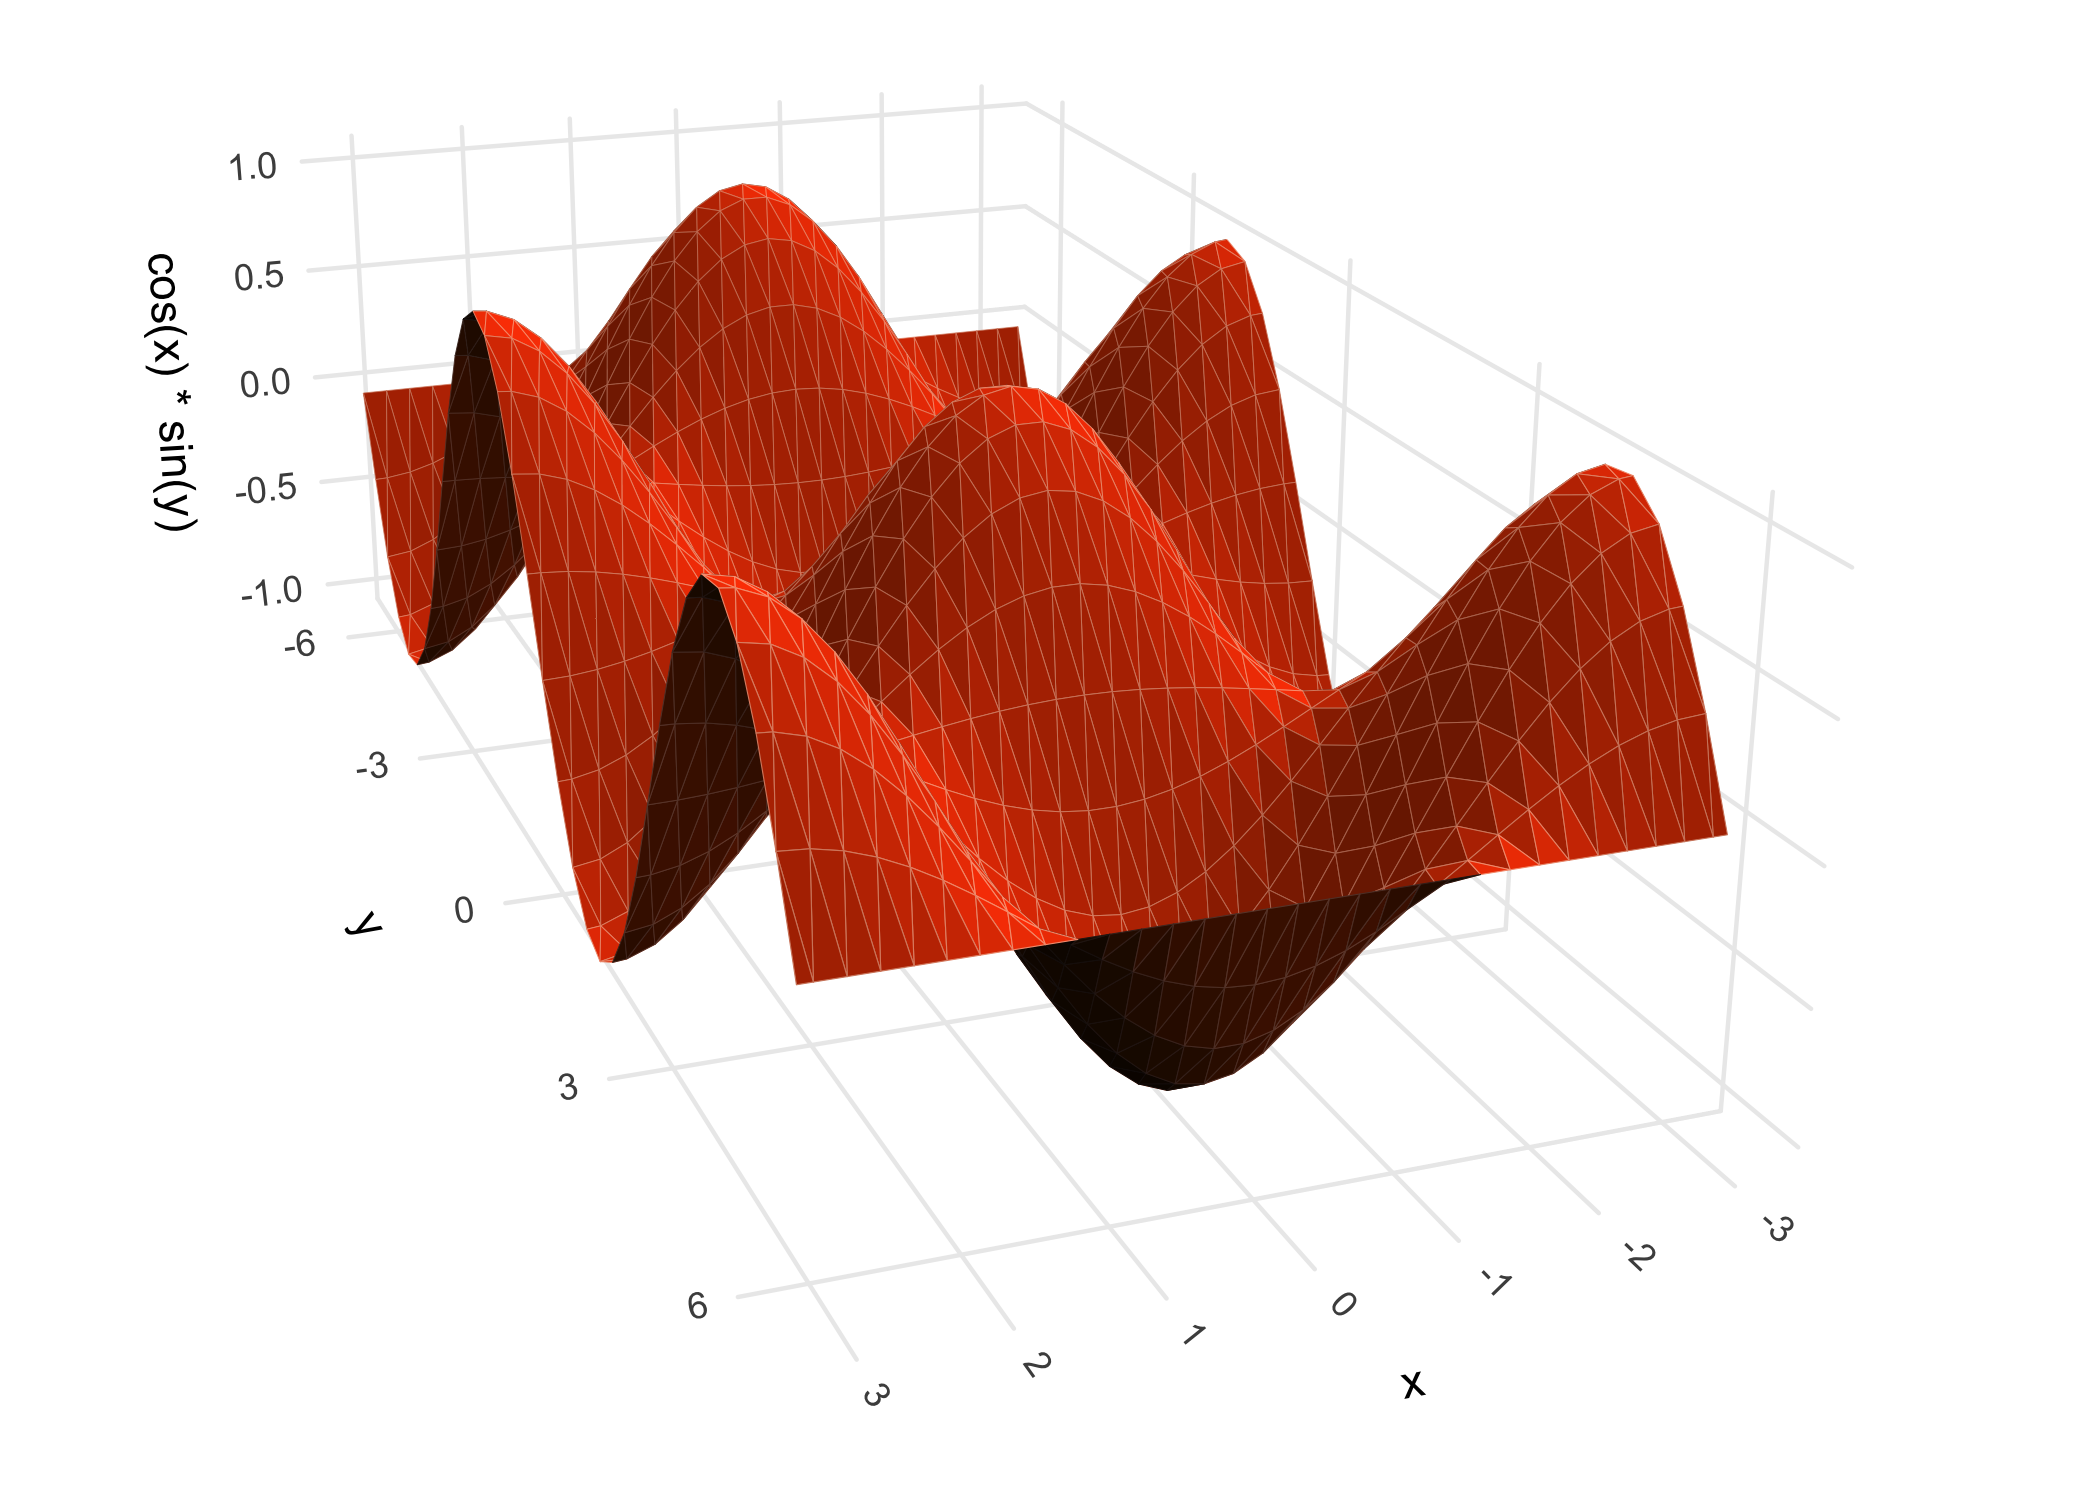
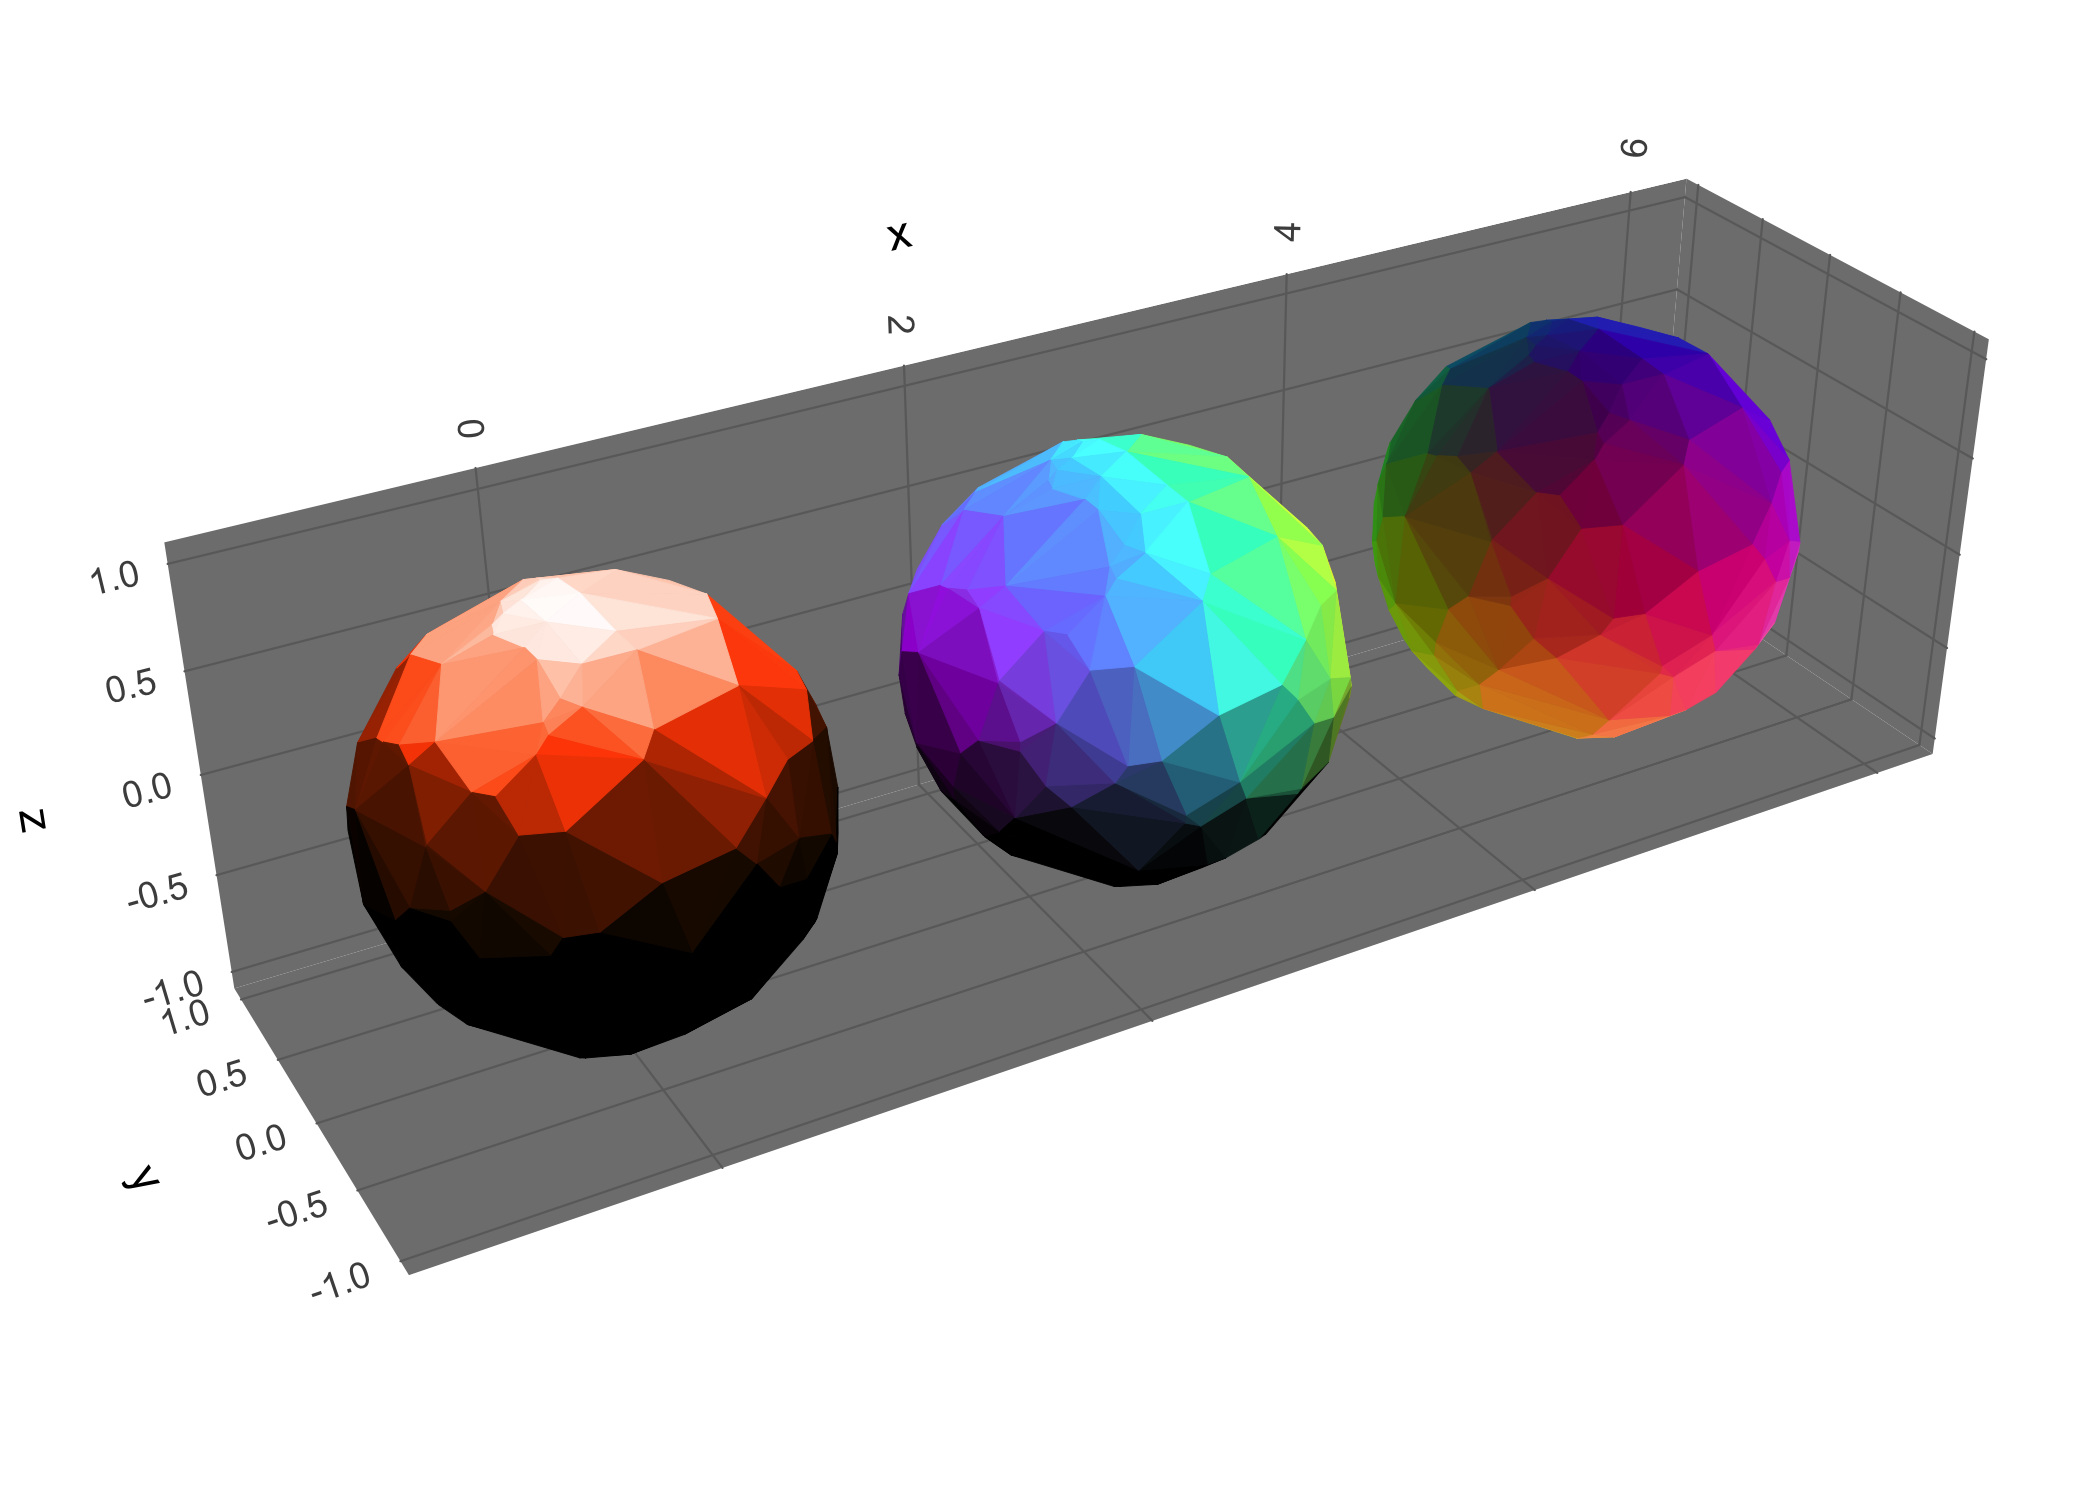
The ggcube R package lets you build 3D figures using ggplot2. While there are numerous 3D visualization libraries in R, none of them seamlessly integrates with ggplot2, which is limiting given ggplot’s elegance, flexibility, and widespread usage. ggcube aims to help fill this gap.
The package is based around coord_3d(), a coordinate function you add to a ggplot that lets you define rotation and projection parameters for plots with x, y, and z aesthetic variable. ggcube also provides a variety of 3D-specific geoms to render surfaces, prisms, points, and paths in 3D; it also works with some standard ggplot2 layer functions. You can control plot geometry with 3D projection parameters, can apply a range of 3D lighting models, and can mix 3D layers with 2D layers rendered on cube faces. Standard ggplot2 features like faceting, themes, scales, and legends work as expected.
Resources
The package is available on CRAN via install.packages("ggcube"), or you can install the development version from GitHub using devtools::install_github("matthewkling/ggcube").
- The getting started vignette gives a tour of the main features.
- The 3D view, surfaces, and lighting and shading articles go deeper on those topics.
- The function reference documents every exported function.