Ombrothermy
[WEB APP] A tool to explore seasonal water balance patterns.
To understand how a location’s climate is likely to shape the local ecology, we need a lot more info than just mean annual temperature and precipitation. The seasonality of these variables, and the interactions between heat and moisture, are key. I built a simple Shiny app that graphs these patterns for any location in the world – this was mostly for my own use, but I’ve had a few requests to share so thought I’d post it here.
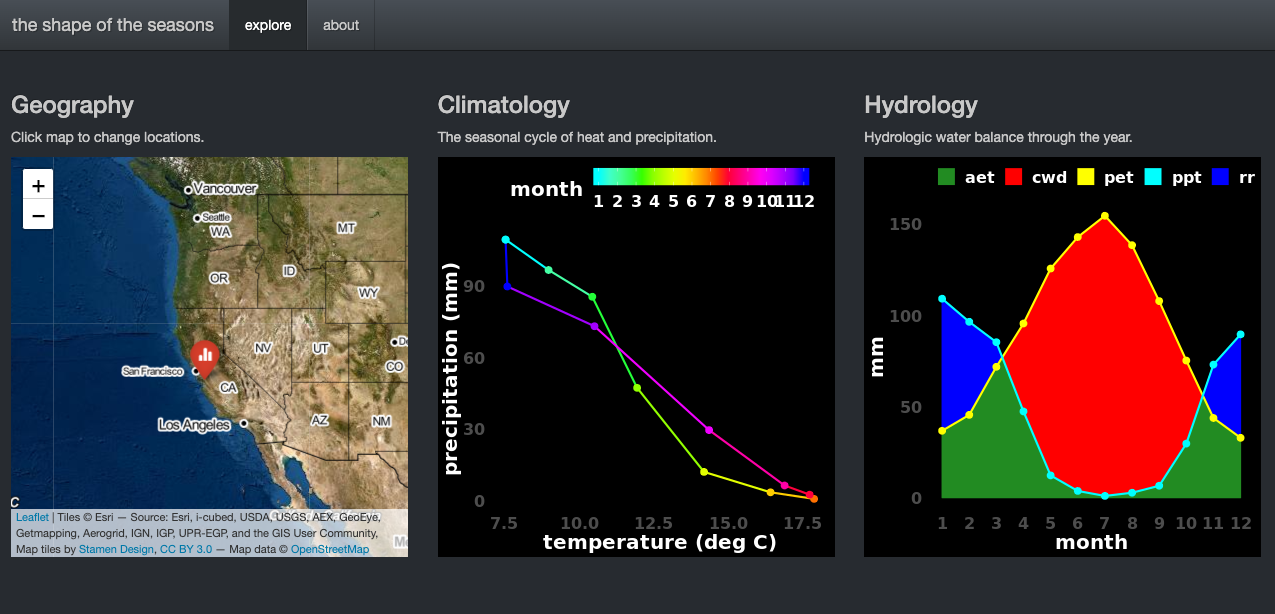
The app includes three panels. The first is a global map users click to select a location, and the other two present alternative views of the 12 monthly temperature and precipitation variables for that site. In panel 2 we see monthly temperature plotted against precipitation, with the 12 months of the year forming a ring; check out this post and this paper to see how these patterns can differ geographically.
The third panel displays a water balance or “ombrothermic” chart of the location’s climate. The classic ombrothermic chart simply plots temperature and precipitation on separate axes, but we can do one better. Converting temperature into potential evapotranspiration (PET) gives moisture demand from the atmosphere, which like precipitation (PPT) is measured in mm. Integrating the different intersections of these curves then gives several important variables that shape plant ecology. The minimum of PET and PPT, actual evapotranspiration (AET), represents the potential for plant growth considering both temperature and moisture limitation. Climatic water deficit (CWD), the positive difference between PET and PPT, is a measure of dryness indicating the potential for drought stress in plants. And recharge and runoff (RR) represents precipitation that’s not used by plants and flows into rivers or recharges groundwater. This view of climate is particularly salient in places with mediterranean-type climates, where heat and moisture, the two key ingredients for plant growth, peak at opposite times of year.
These estimates are crude and don’t account for the hydrologic and physiological effects of soils, vegetation, snow storage, and storm event timing, but they give a first approximation of the key aspects of seasonal heat and moisture patterns. Let me know what you think!