This function returns a color value for each row of the 2-column dataset
supplied, based on a 2D color palette interpolated from 4 corner colors.
Usage
colors2d(
  data,
  colors = c("yellow", "green", "blue", "magenta"),
  xtrans = c("none", "log", "rank"),
  ytrans = c("none", "log", "rank")
)
Arguments
- data
Matrix or data frame with 2 numeric columns; they will map to x
and y.
- colors
Vector of 4 corner colors to interpolate, clockwise from upper
right.
- xtrans, ytrans
Transformation to apply to x and y variables before
applying a linear color mapping: either "none" (default), "log", or "rank".
Value
Character vector of colors.
Examples
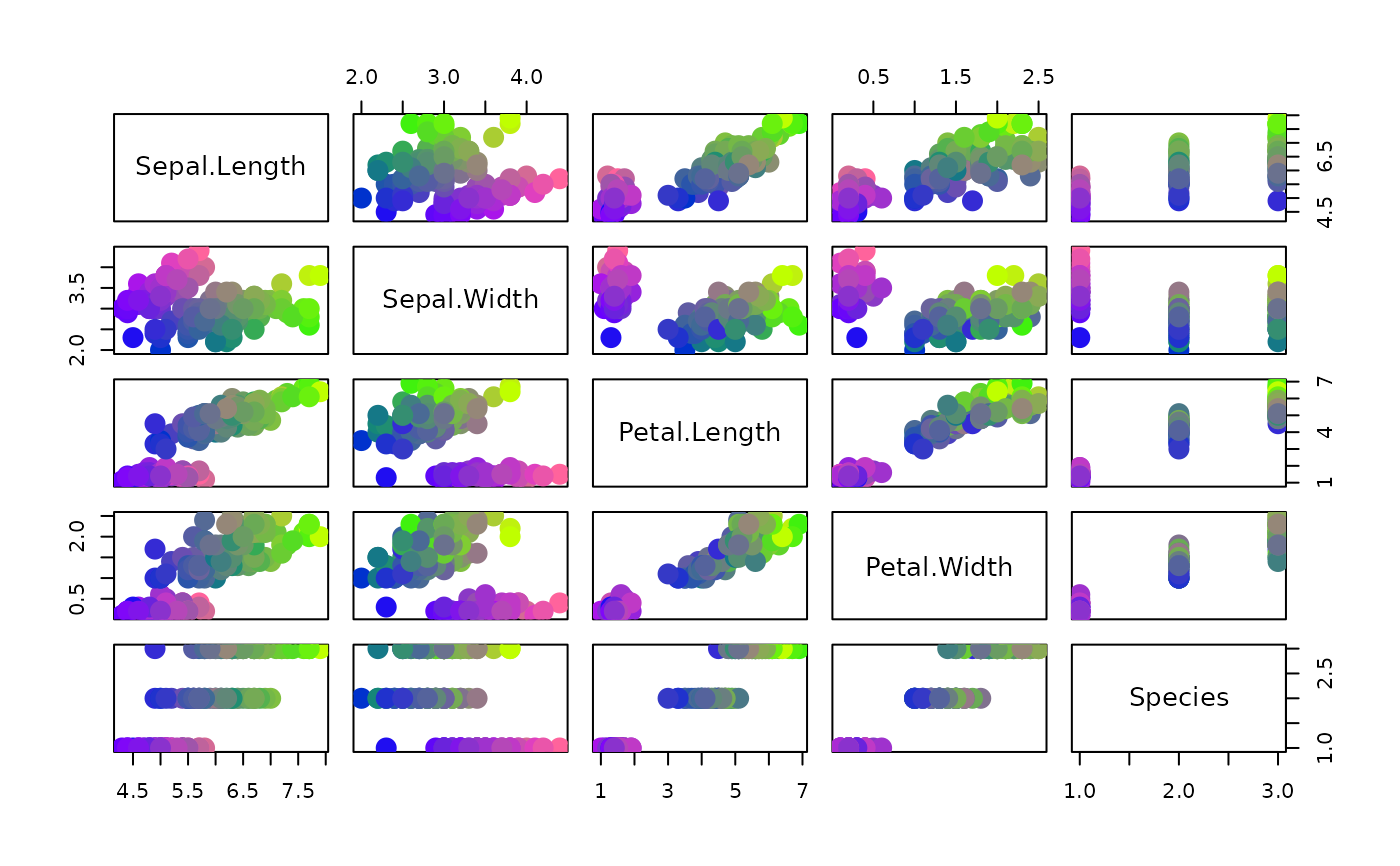
plot(iris,
     col = colors2d(iris[, c("Sepal.Length", "Sepal.Width")]),
     pch = 19, cex = 2)


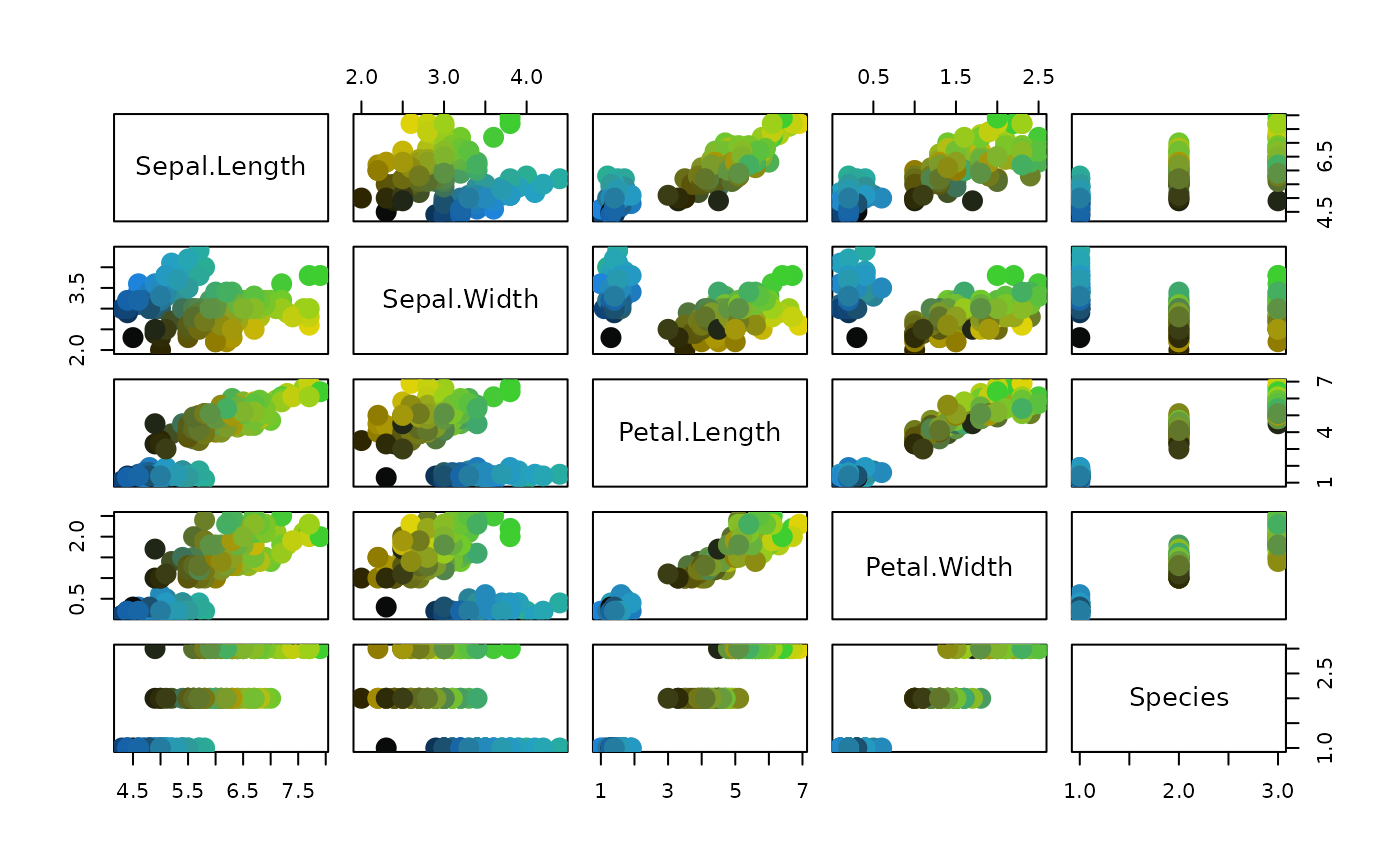
plot(iris,
     col = colors2d(iris[, c("Sepal.Length", "Sepal.Width")],
                    colors = c("limegreen", "gold", "black", "dodgerblue"),
                    xtrans = "rank", ytrans = "rank"),
     pch = 19, cex = 2)


